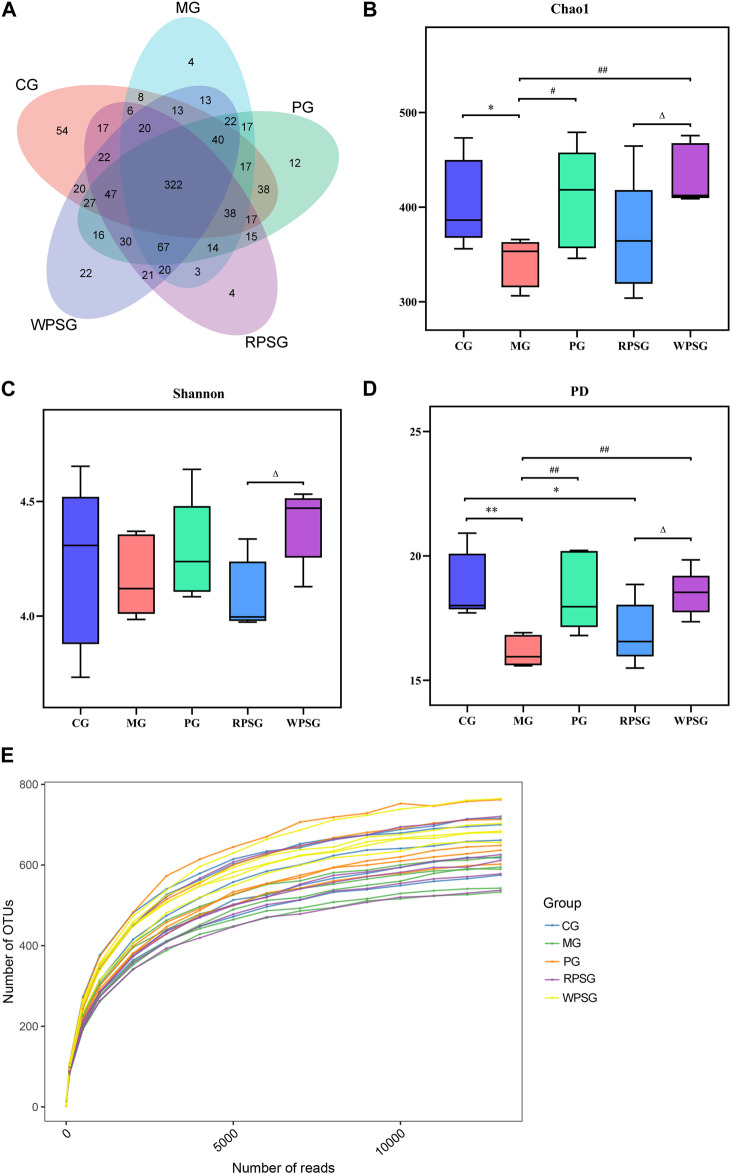
FIGURE 5.
Alpha diversity of the intestinal microbiota (n = 5). (A) Venn diagram; (B) Chao1 index; (C) Shannon index; (D) PD index; and (E) Rarefaction curves. CG, healthy controls; MG, only D-gal; PG, D-gal + VitE (200 mg/kg/day); RPSG, D-gal + RPS (10 g/kg/day); WPSG, D-gal + WPS (10 g/kg/day). * p < 0.05, ** p < 0.01, compared with the CG. # p < 0.05, ## p < 0.01, compared with the MG. ∆ p < 0.05, ∆∆ p < 0.01, compared with the RPSG.

