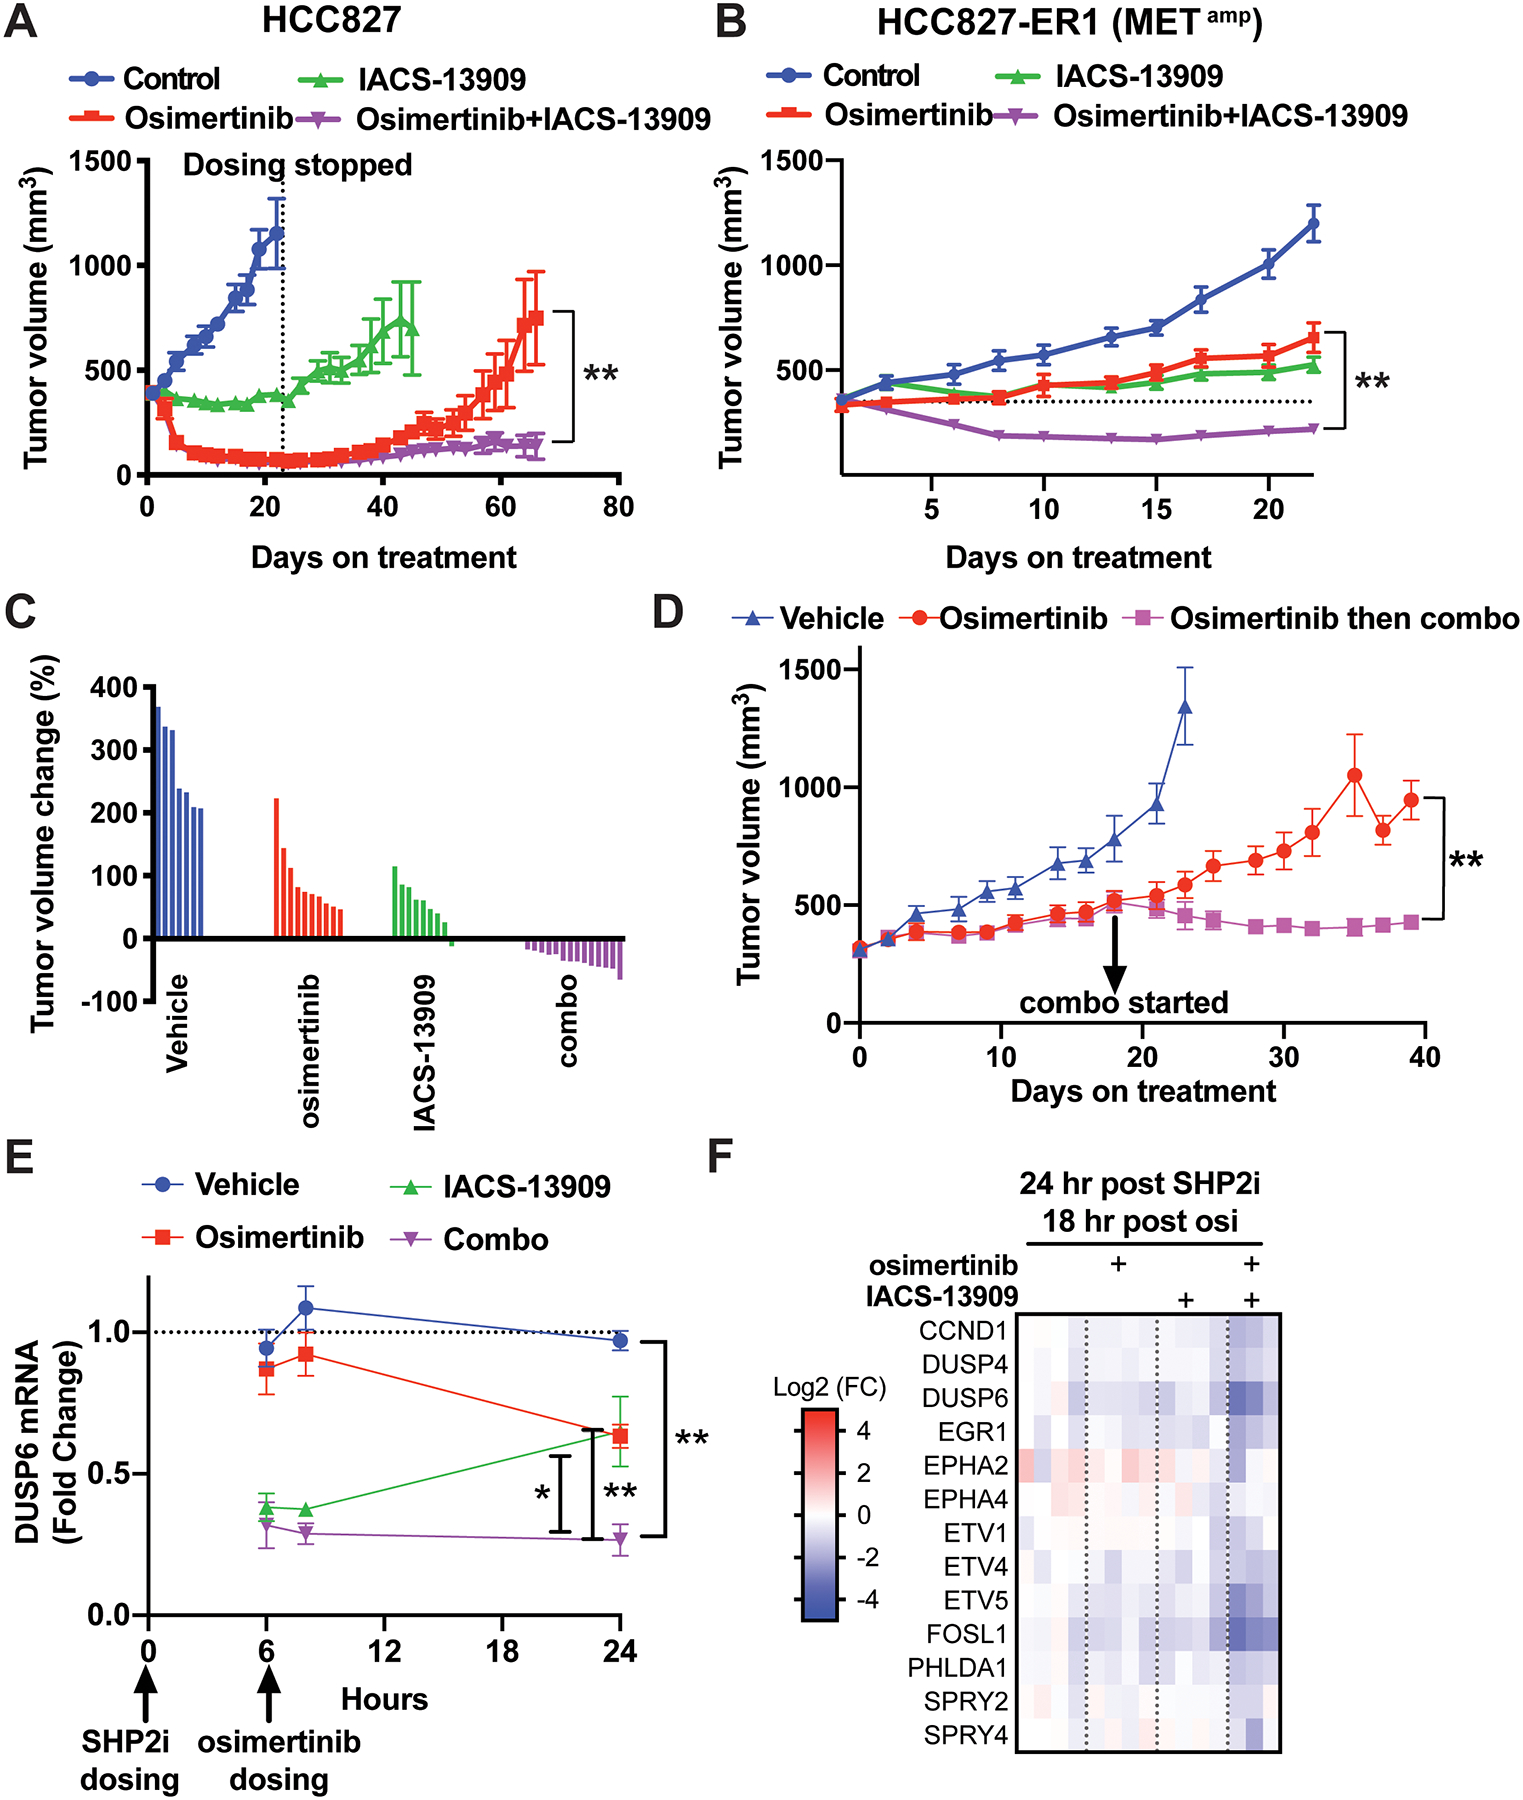
Figure 5. Anti-tumor efficacy of treatment with IACS-13909 and osimertinib, alone and in combination, in a MET-amplified EGFRi acquired resistant model in vivo.

Tumor growth curves of EGFRmut HCC827 (A) and HCC827-ER1(B) xenograft models treated with vehicle (0.5% methylcellulose, QD+0.5% HPMC, QD), osimertinib (0.5% methylcellulose, QD + osimertinib 5 mg/kg, QD), IACS-13909 (IACS-13909 70 or 80 mg/kg, QD+0.5% HPMC, QD), or the combination (IACS-13909 70 or 80 mg/kg, QD + osimertinib 5 mg/kg, QD). In A, n=10 mice per group. In B, n≥10 mice for all groups. In both A and B, the graphs represent pooled data from two independent experiments. In one experiment, IACS-13909 was used at 70 mg/kg, and in the other IACS-13909 was used at 80 mg/kg. 2-way ANOVA was used to compare the tumor growth curves of osimertinib single agent group vs the combination group. **, p<0.01. (C) Relative tumor volume change on day 22 from data shown in B, when dosing ended. The tumor volume of each mouse was normalized to the tumor volume when dosing started. 0 indicates tumor stasis, <0 indicates tumor regression. (D) Anti-tumor efficacy of treatment with the combination of IACS-13909+osimertinib on HCC827-ER1 tumors that outgrew on osimertinib treatment. When average tumor volume reached 300 mm3, mice bearing HCC827-ER1 tumors were treated with vehicle (n=5), or osimertinib (5 mg/kg, QD, n=10). When tumors progressed on osimertinib treatment and reached 500 mm3, the treated tumors were re-randomized and subjected to treatment with osimertinib (5 mg/kg, QD; n=5) or the combination (osimertinib 5 mg/kg, QD + IACS-13909 70 mg/kg, QD; n=5). 2-way ANOVA was used to compare osimertinib single agent group vs combination group. **, p<0.01. (E) Modulation of DUSP6 mRNA levels in HCC827-ER1 subcutaneous tumors during a 24-hour time period following one day treatment, as conducted in B. Tumor samples were harvested at hour 6, 8 and 24. DUSP6 mRNA levels were determined by qRT-PCR. N=4 mice per group for each timepoint. 2-tail t-test was conducted to compare the combination group vs vehicle or single agent groups. *, p<0.05; **, p<0.01. (F) Gene expression analysis was conducted with tumor samples harvested at the 24-hour post SHP2i/18-hour post osimertinib timepoint in E. Modulation of a MAPK-pathway signature (MPAS-plus) by osimertinib, IACS-13909 and the combination is shown.
