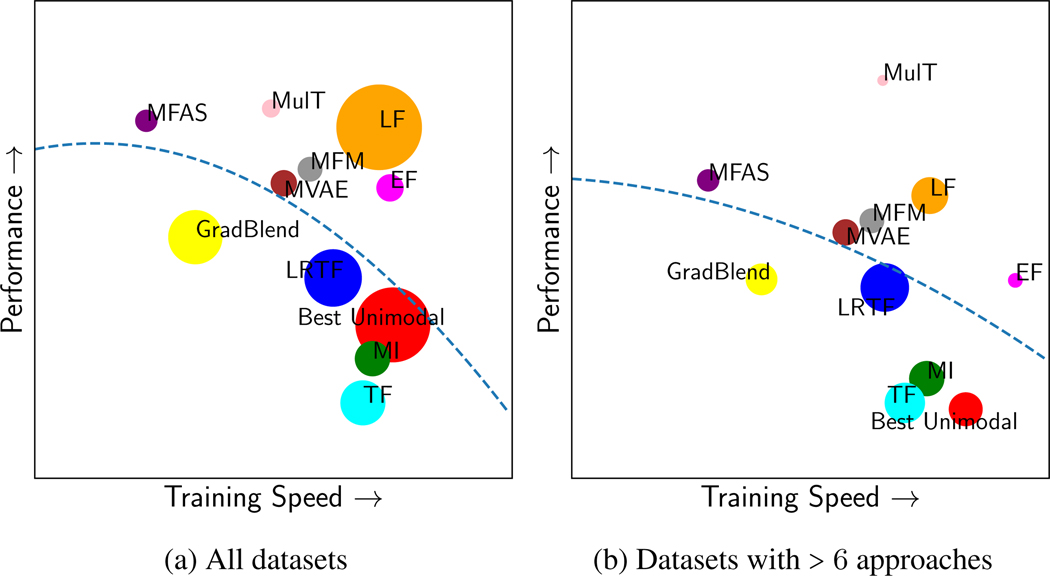
Figure 3: Tradeoff between performance and complexity.
Size of circles shows variance in performance across (a) all datasets and (b) datasets on which we tested >6 approaches. We plot a dotted blue line of best quadratic fit to show the Pareto frontier. These strong tradeoffs should encourage future work in lightweight multimodal models that generalize across datasets, as well as in adapting several possibly well-performing methods (such as MFAS or MulT) to new datasets and domains.

