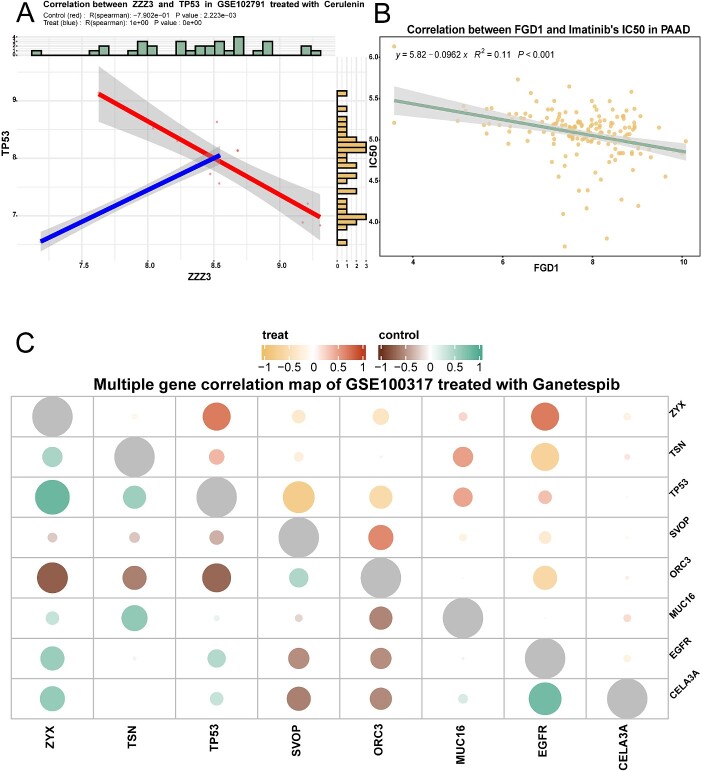
Figure 3.
Genetic correlation analysis module: correlation analysis of multigene expression/single gene expression with drug IC50 before and after drug treatment. (A) The scatter plot demonstrates the correlation between ZZZ3 and TP53 before and after cerulenin treatment in GSE120791, and the R value was calculated by Spearman. (B) The scatter plot shows the correlation between the expression of the FGD1 gene and IC50 in pancreatic cancer cases treated with imatinib. The R value was calculated by the Spearman algorithm. (C) The bubble plots demonstrate the polygenic correlations in GSE100317 for the ganetespib treatment group compared to the control group. The upper right corner represents the correlation in the treatment group, and the lower left corner represents the correlation in the control group.

