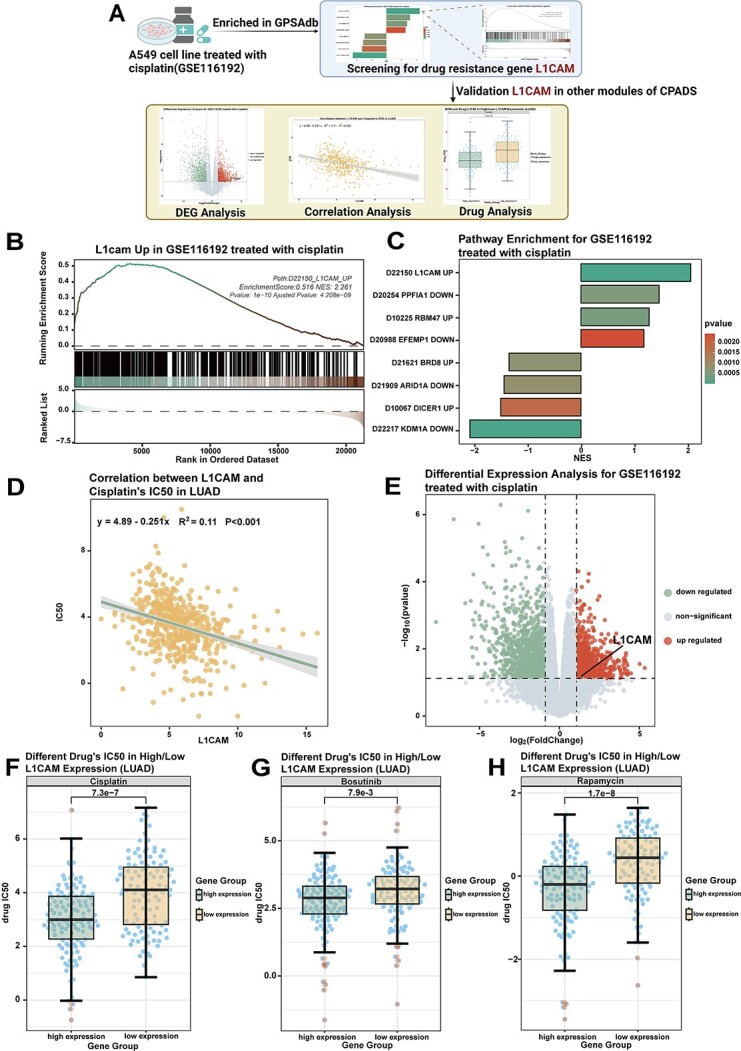
Figure 6.

Screening for the drug resistance gene L1CAM using gene perturbation analysis. (A) Workflow diagram showing the process of screening for the drug resistance gene L1CAM by combining the gene perturbation module with other drug sensitivity analysis modules. (B) The GSEA graph shows the enrichment analysis of the differentially expressed gene of GSE116192 in the gene set ‘D22150_L1CAM_UP’. (C) The bar graph shows the enrichment of GSE116192 in GPSAdb. The colours represent the high and low P-values. (D) Volcano plot showing the results of the differential analysis performed by GSE116192. L1CAM gene expression was increased after cisplatin treatment. (E) Correlation scatter plot demonstrating the correlation between L1CAM gene expression and cisplatin IC50 in LUAD cases in TCGA. LUAD, lung adenocarcinoma, R value calculated by the Spearman algorithm. (F) The box plot demonstrates the difference in the IC50 of cisplatin between the high and low expression groups after grouping LUAD cases in TCGA according to L1CAM gene expression. P-values were calculated by the Wilcoxon rank sum test. (G) The box plot demonstrates the difference in the IC50 of bosutinib between the high and low expression groups after grouping LUAD cases in TCGA according to L1CAM gene expression. P-values were calculated by the Wilcoxon rank sum test. (E) The box plot demonstrates the difference in rapamycin IC50 between the high and low expression groups after grouping LUAD cases in the TCGA according to L1CAM gene expression. P-values were calculated by the Wilcoxon rank sum test.
