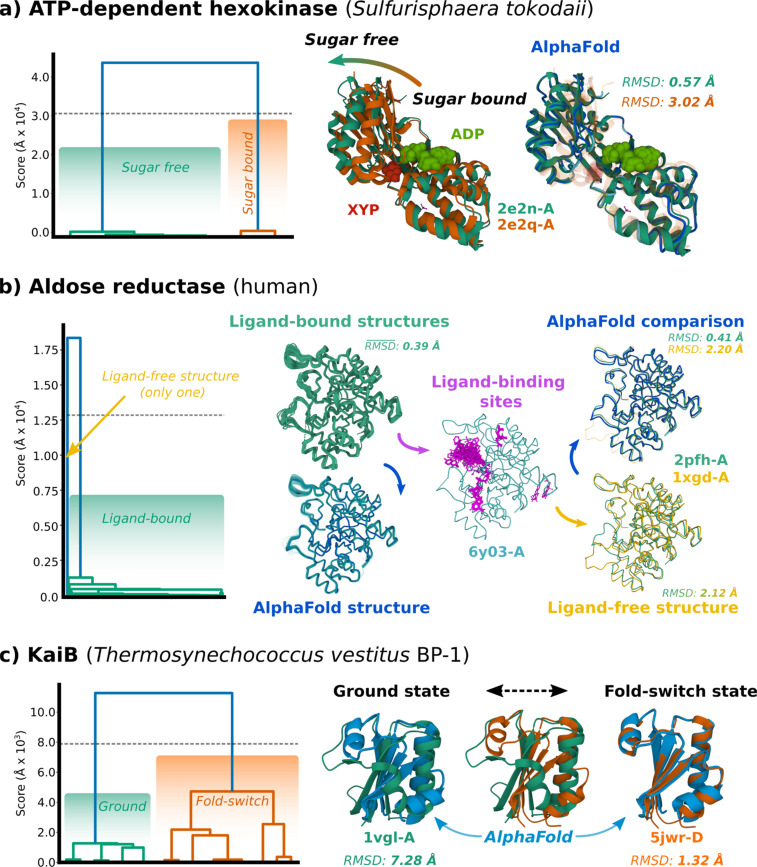
FIG. 3.
Notable examples of predicted conformational states by the PDBe-KB. (a) Clustering results in dendrogram (left) and structures (right) of the open–closed conformation change made by UniProt: Q96Y14. XYP (red) denotes β-d-xylopyranose and ADP (light green) denotes adenosine triphosphate, both bound to 2E2Q chain A. 2E2N chain A is an apo-form of the polypeptide. RMSD calculated between AlphaFold2 model and experimental structures. (b) Substrate promiscuity illustrated by consistent binding of diverse ligands (magenta), despite the polypeptide (UniProt: P15121) adopting a consistent conformation. Mean RMSD displayed for the collection of ligand-bound structures (top left), the AlphaFold2 structure to the two representative chains (top right), and between representative chains (bottom right). Structural variation between ligand-bound structures is relatively low, with a standard deviation in RMSD of 0.16 Å. Ligand-free structure (yellow) has a displaced loop in the Pro211-Asp230 region. (c) Fold-switch protein (UniProt: Q79V61) transitioning to control day–night cycle. Clustering dendrogram (left) with AlphaFold2 structure superposed alongside experimentally determined models. RMSD calculated between AlphaFold2 model and experimental structures.

