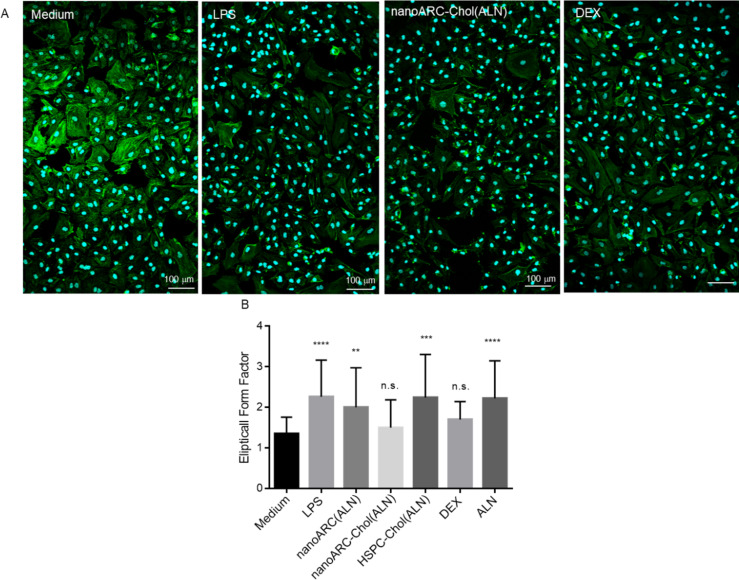
Figure 12.
Morphological changes induced by LPS on HUVECs. (A) Representative fluorescence confocal microscopy images of HUVECs from the mild inflammation model. Cells were labelled with CytoPainter Phalloidin-iFluor 488 (actin) and Hoechst 33342 (nucleus). Scale bar: 100 µm. (B) Elliptical form factor (EFF). The EFF was calculated using ImageJ software analysis of cell morphology by dividing the major axis by the minor axis as an average of 100 cells [58].

