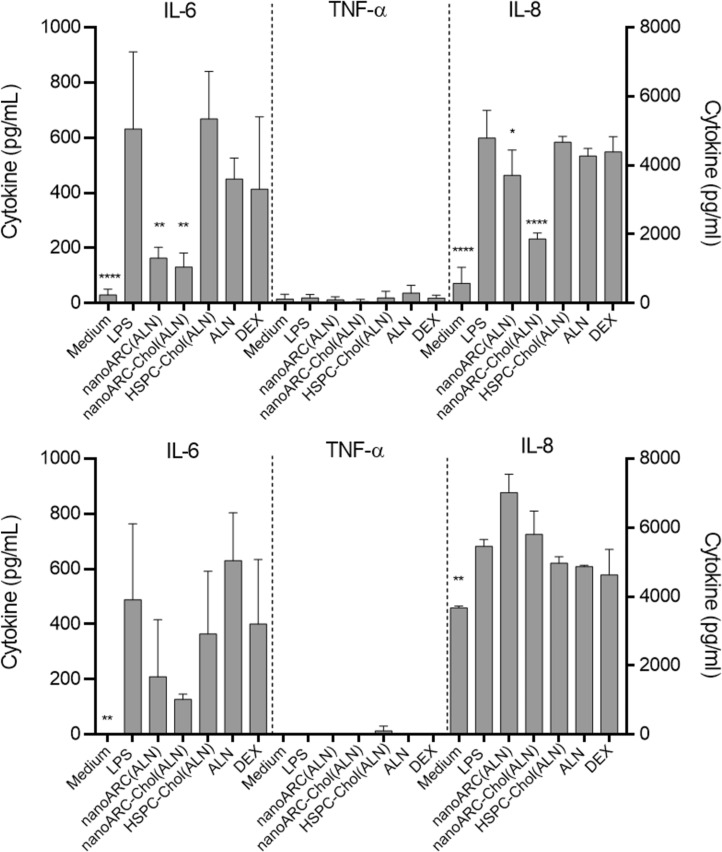
Figure 9.
Effect of nanovesicle uptake on cytokines released in the mild inflammation model: (A) apical (HUVEC) and (B) basolateral (THP-1 macrophages). Values of IL-6 and TNF-α are shown on the left Y axis, and values of IL-8 are shown on the right Y axis. Data are expressed as mean ± SD (n = 3). Asterisks indicate significant differences against LPS.

