Fig. 1.
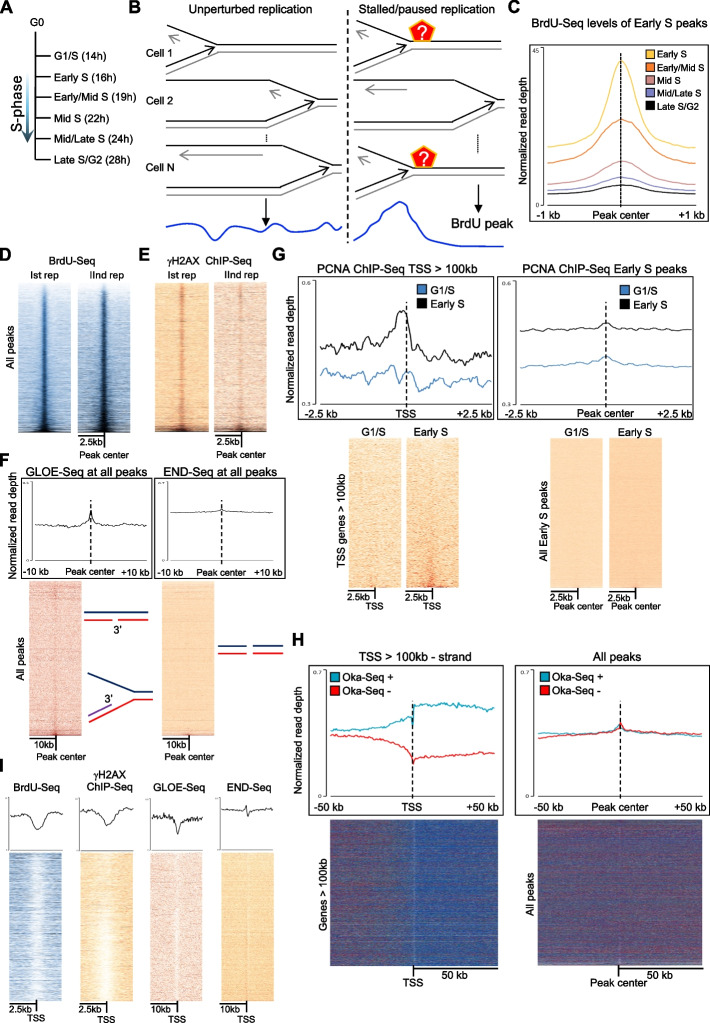
Identification of replication fork stalling/pausing hotspot sites. A Schematic of the kinetic of the experiment with indicated the timepoints following serum starvation: G1/S (14 h), Early S (16 h), Early/Mid S (19 h), Mid S (22 h), Mid/Late S (24 h), and Late S/G2 (28 h). B Schematic of the working model describing how BrdU peaks represent hotspot sites of replication forks slow down/pausing. Panel on the left: if DNA replication progresses unperturbedly through a genomic region in a cell, by averaging the BrdU-Seq signal over a population of cells, we will obtain a relatively flat profile. However, if in a specific site there is a hotspot where replication forks slow down/pause/stall, and this hotspot occurs frequently in a population of cells, when we average the BrdU-Seq signal over that region, the profile will show a peak as there is an overrepresentation of specific reads. We can computationally identify these sites performing a peak calling analysis. C Average metagene profile of BrdU-Seq normalized to Input DNA at the BrdU peaks called in Early S ± 1 kb in all the other timepoints. D Heatmap analysis of the two BrdU-Seq experiments normalized to Input DNA from [14] at all the BrdU peaks sorted by the intensity of the BrdU-Seq signal, ± 2.5 kb. E Heatmap analysis of γH2AX-Seq from [14] at all the BrdU peaks sorted by the intensity of the BrdU-Seq signal, ± 2.5 kb. F Average metagene profile and heatmap analysis of GLOE-Seq [18] and END-Seq [19] levels at all the BrdU peaks, ± 10 kb. G Average metagene profile and heatmap analysis of ChIP-Seq of PCNA at the Early S and G1/S timepoints at the TSS of genes > 100 kb transcribed in the Early S timepoint and at BrdU peaks identified in the first timepoint, ± 2.5 kb. H Average metagene profile and heatmap analysis of strand specific Oka-Seq from [12] at the “ + ” and the “–” strand, at TSS of genes > 100 kb transcribed on the “-” strand and at all the BrdU peaks, ± 50 kb. I Average metagene profile and heatmap analysis of BrdU-Seq, γH2AX ChIP-Seq, GLOE-Seq, and END-Seq at TSS of genes > 100 kb, ± 10 kb

