Fig. 2.
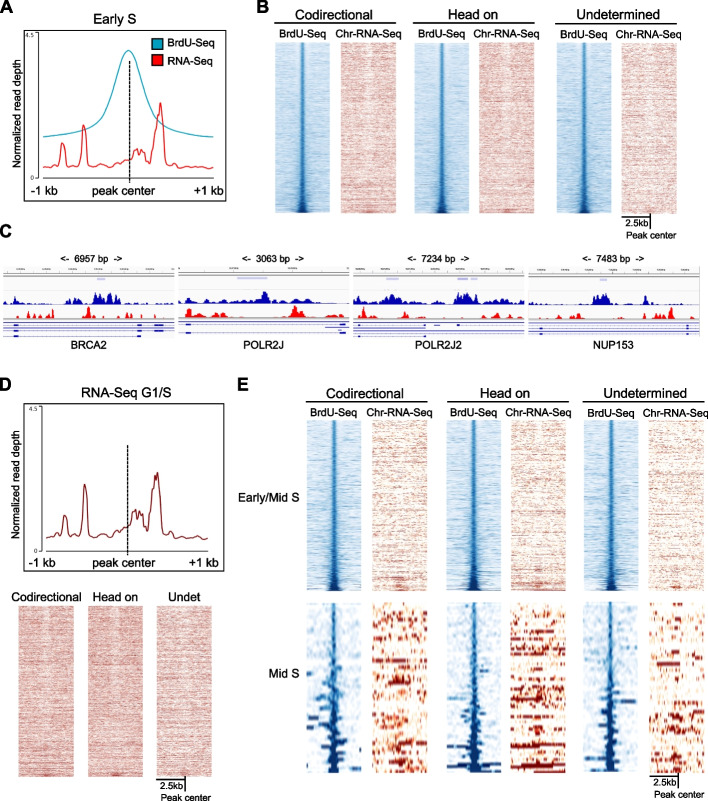
Correlation between DNA replication and transcription progressions. A Average metagene profiles of BrdU-Seq (blue) and Chr-RNA-Seq (red) levels from the Early S timepoint at BrdU peaks called in Early S ± 1 kb. B Heatmap analysis of BrdU-Seq (blue) and Chr-RNA Seq (red) signal across BrdU peaks called in Early S ± 2.5 kb, depending on the reciprocal directionality between DNA replication leading fork and transcription in codirectional, head on or undetermined, ranked by BrdU-Seq signal intensity. C BrdU-Seq (blue) and Chr-RNA-Seq (red) profiles across specific BrdU peaks, indicated by the light blue bar in the listed genes, with indicated the width of the region showed. D Average metagene profile of Chr-RNA-Seq levels and heatmap analysis from the G1/S timepoint across all the BrdU peaks called in Early S ± 1 kb, separated by directionality; Undet = undetermined. E As B but for BrdU peaks called in Early/Mid S and Mid S

