Fig. 4.
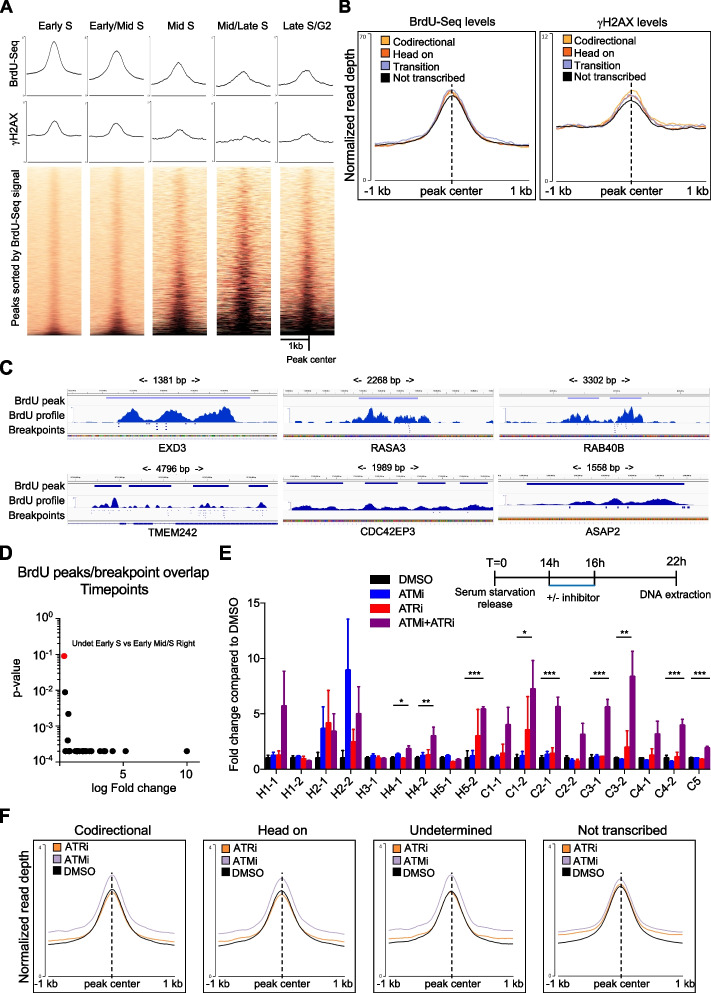
BrdU peaks are hotspot of genome instability and rearrangements at transcription-replication collision sites require ATM and ATR. A Average metagene profile and heatmap analysis for γH2AX at BrdU peaks identified in all timepoints, sorted by BrdU-seq levels as Fig. 1D. B Average metagene profile for BrdU levels normalized to Input DNA and γH2AX levels at peaks called in Early S, separated depending on the specific location of the peak. C Single BrdU peak examples overlapping with breakpoints of rearrangements from Cosmic website. D Comparison of the frequency of increased overlap of BrdU peaks called in the first timepoint with breakpoints towards all the other timepoints measured in fold change with relative permutation p-value, analyzing separately the left (L) and the right (R) breakpoint for each rearrangement; highlighted in red is the only comparison that is not statistically significantly different. E Fold change compared to DMSO of detection of specific rearrangements by RT-PCR, following treatment in Early S for 2 h with ATMi (10 μM), ATRi (4 μM), or ATMi and ATRi together; n 4, average mean ± SEM, two-sided Student t-test. F Average metagene profile for BrdU levels normalized to Input DNA at BrdU peaks in Early S separated in codirectional, head on, undetermined or not transcribed; cells treated as in D with BrdU added in the last hour. * ≥ p-value < 0.05 ** ≥ p-value < 0.01, *** ≥ p-value < 0.001

