Fig. 2.
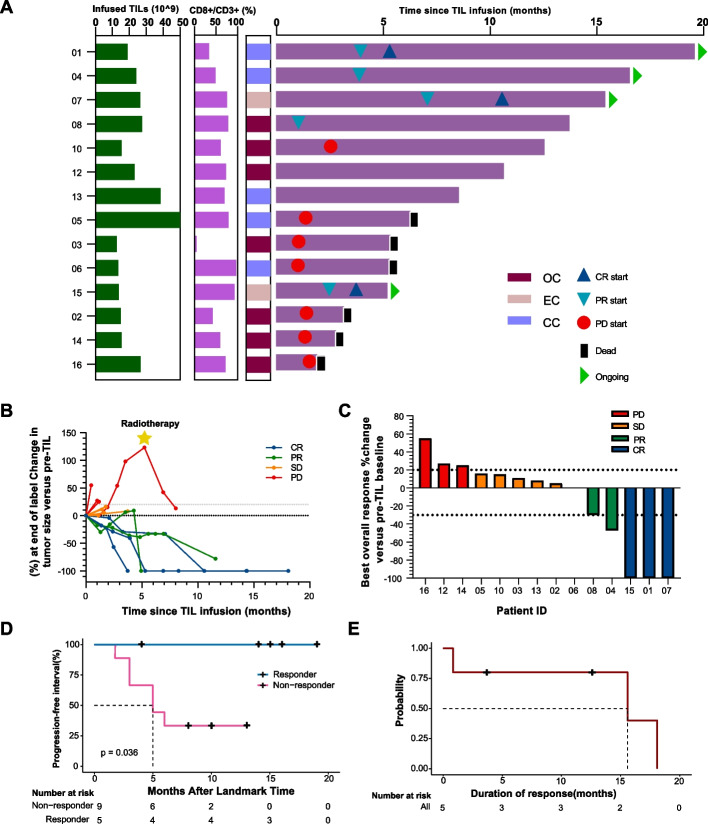
Clinical responses of modified TIL therapy. A Swimmer plot of treatment duration. The length of each bar represents the treatment duration for each patient. Three complete responses were ongoing 19.5, 15.4, and 5.2 months. Patient 04 had a partial response, with one lesion remaining in complete remission for 17 months, while another small non-target lesion progressed 1 month after TIL infusion, which was removed by surgery 7 months after infusion maintaining clinical remission up to the present. B Spider plot of measurements of target lesions at each timepoint. C Waterfall plot of the best change in the sum of target lesion size compared with that at baseline. The horizontal line at 20% indicates progressive disease, and at − 30% indicates the threshold for defining an objective response in the absence of non-target disease progression or new lesions according to RECIST 1.1. D Kaplan–Meier curves for overall survival in responders and non-responders. CR, complete response; PD, progressive disease; PR, partial response; SD, stable disease. E Kaplan–Meier curve demonstrates the duration of response, defined as the time from the achievement of a response to progression. Among 5 responders, the median duration of the response was 15.6 months (95% exact lower confidence limit =15.6 months; upper confidence limit has not been reached)

