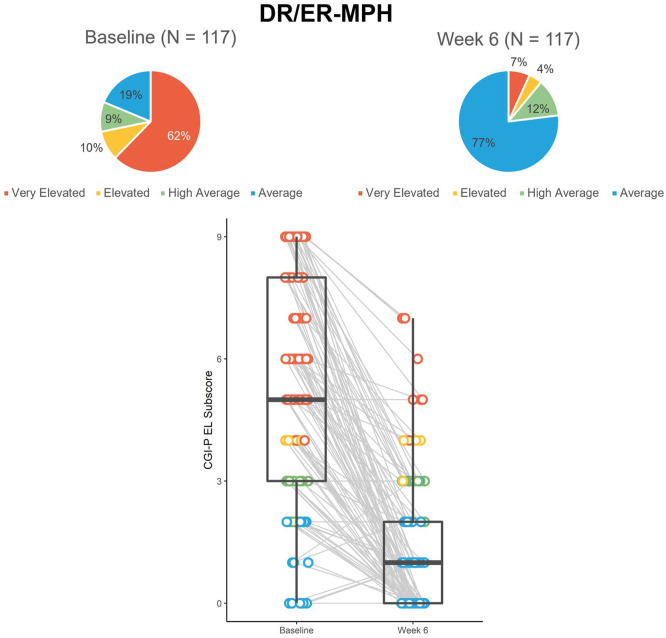
Figure 5.
Proportion and distribution of CGI-P EL scores color-coded by severity from the open-label phase of study HLD200-107.a
Note. CGI-P = Conners’ Global Index—Parent; DR/ER-MPH = delayedrelease and extended-release methylphenidate; EL = emotional lability.
aBox-and-whisker plots show the distribution of the dataset. The box shows the median (middle of the data points), upper quartile (25% of data points are greater than this value), and lower quartile (25% of data points are lower than this value). The tails show the minimum and maximum values.

