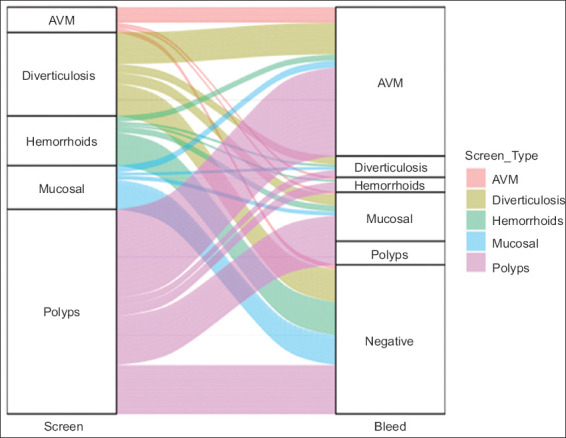
Figure 4.

Alluvial diagram tracking the transition from pre-LVAD endoscopic findings to post-LVAD bleeding sources in a cohort of 101 patients with at least 1 positive screening result. The diagram quantitatively correlates these screening findings with subsequent bleeding sources post-LVAD implantation. The thickness of the bars and connecting lines is proportional to represent the number of occurrences of each finding (vertical bars) and the transitions between states (horizontal lines for pre- to post-LVAD transition)
