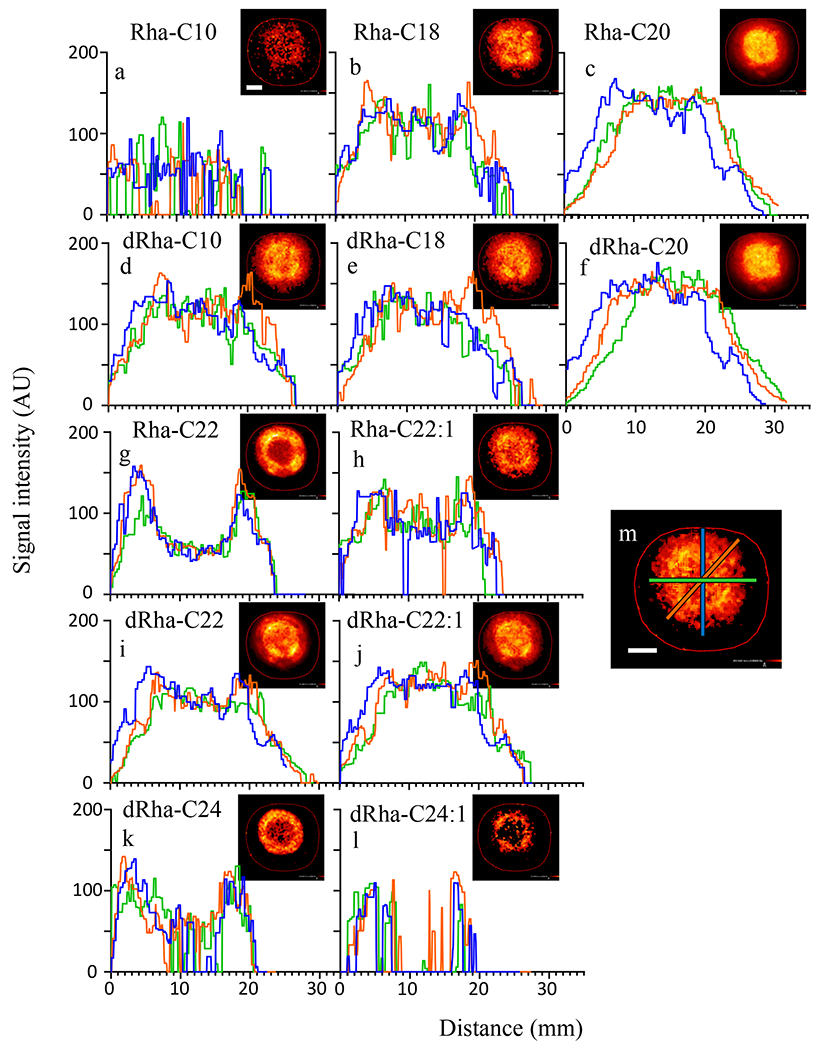
Figure 1.

Radial distribution of rhamnolipid on agar varies with congener structure. The spatial MSI intensity profiles (a-l) from three cross sections of heat maps of congener distribution (insets) show diverse distribution patterns of rhamnolipid congeners of CFSM allowed to spread on 1.5% agar. Locations of cross-section signal intensity measurements correlate to blue, orange, and green lines, as depicted in image m, and indicate a diversity in both radial symmetry and small shifts in localization for the different congeners detected. Scale bar is 7 mm.
