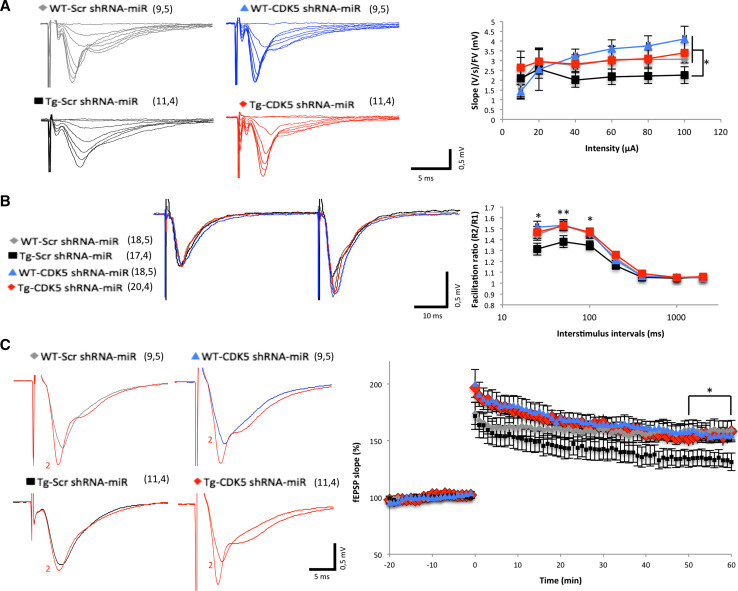
Fig. 2.
CDK5 shRNA-miR recovers PPF and LTP in adult APPswe/PS1Δ9 mice. a Example eEPSP traces recorded with increasing stimulation intensity, eEPSP slope, FV, and eEPSP slope/FV amplitude ratio plotted against stimulation intensity, and eEPSP slope vs FV amplitude. Note the recovery of the eEPSP slope/FV amplitude ratio in Tg-CDK5 shRNA-miR compared with Tg-Scr shRNA-miR. Repeated-measures ANOVA [F(5, 15) = 4.552, **p < 0.01], followed by the Tukey’s post-hoc test (*p < 0.05). b Representative eEPSP traces taken at 50 ms ISI. Reduced PPF ratio at shorter (25, 50, 100 ms) ISIs in Tg-Scr shRNA-miR, which is recovered in Tg-CDK5 shRNA-miR treatment to control values. Repeated-measures ANOVA [F(6, 18) = 125.4, ****p < 0.0001], followed by the Tukey’s post-hoc test (*p < 0.05 or **p < 0.01). c A decrease in the magnitude of LTP following a 4× TBS protocol in 6-month-old Tg-Scr shRNA-miR mice and a recovery of magnitude of LTP in Tg-CDK5 shRNA-miR mice (WT-Scr shRNA-miR, 158.68 ± 8.79 % of baseline at 1 h after 4× TBS; Tg-Scr shRNA-miR, 135.15 ± 7.69 %; WT-CDK5 shRNA-miR, 155.82 ± 5.78 % Tg-CDK5 shRNA-miR, 155.46 ± 7.20 %. Repeated-measures ANOVA [F(81, 243) = 86.65, ****p < 0.0001], followed by the Tukey’s post-hoc test (*p < 0.05) in the last ten min. Insets show representative eEPSP traces (gray, black, blue, and red lines represent baselines of each treatment; red line (indicated by 2), 1-h post-induction stimulation). The values in parentheses indicate: the number of hippocampal slices and the number of animals used

