Fig. 4.
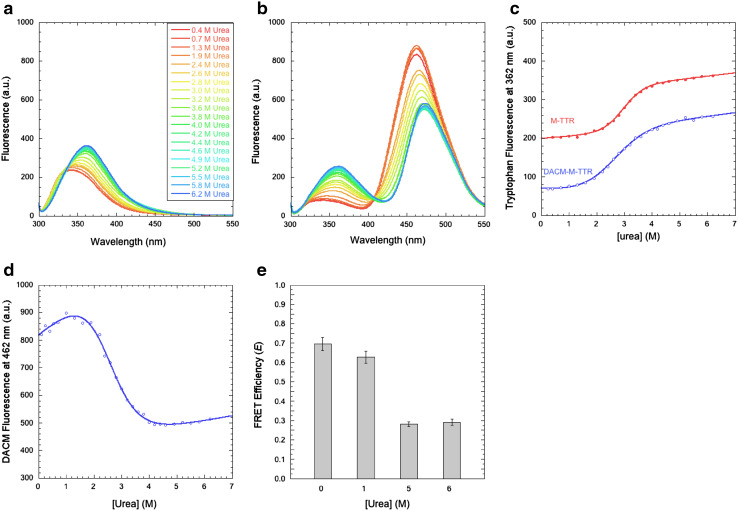
FRET of urea-unfolded and molten globule states of M-TTR. a, b Fluorescence spectra of M-TTR (a) and DACM-M-TTR (b) at urea concentrations ranging from 0 to 6.2 M at pH 7.4, 25 °C (excitation 290 nm). c Urea denaturation curves (spectroscopic signal versus urea concentration) using tryptophan fluorescence at 362 nm as a spectroscopic probe for both M-TTR and DACM-M-TTR. d Urea denaturation curve of DACM-M-TTR, using DACM fluorescence at 462 nm as a spectroscopic probe. e FRET E values at the indicated urea concentrations, pH 7.4, 25 °C

