Fig. 5.
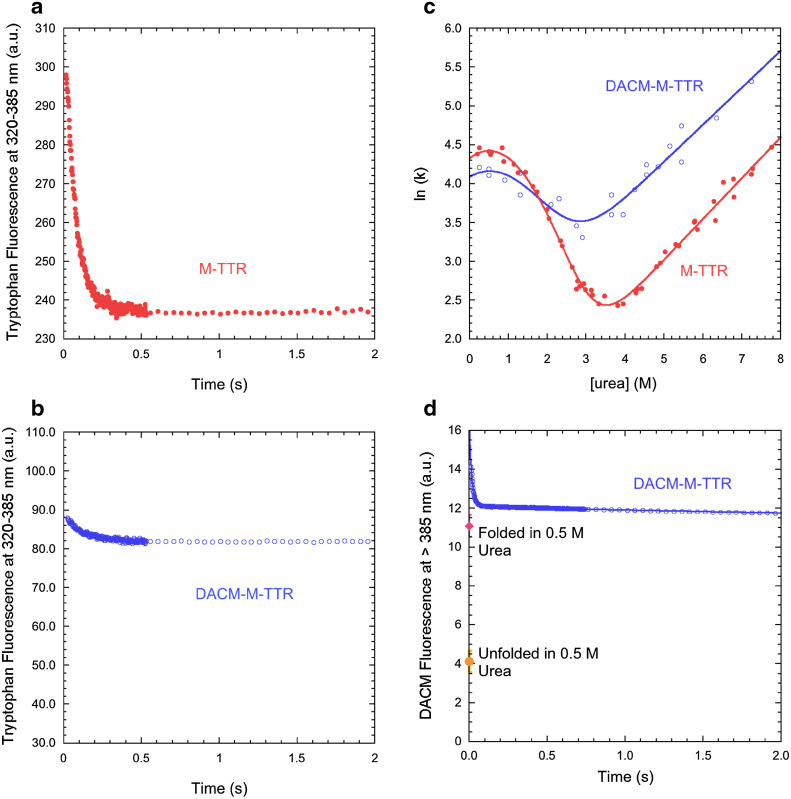
FRET during M-TTR refolding. a, b Refolding time course of M-TTR (red filled circles) and DACM-M-TTR (blue open circles) monitored by tryptophan fluorescence (excitation 290 nm, emission 320–385 nm) in 0.5 M urea at pH 7.4, 25 °C. c Natural logarithm of the observed folding/unfolding microscopic rate constants for DACM-M-TTR (blue open circles) compared to data previously published for M-TTR (red filled circles) [28], plotted as a function of urea concentration (chevron plot), at pH 7.4, 25 °C. d Refolding time course of DACM-M-TTR (blue open circles) monitored by DACM fluorescence (excitation 290 nm, emission >385 nm) in 0.5 M urea at pH 7.4, 25 °C. The signals of folded and unfolded DACM-M-TTR are also indicated

