Abstract
Clostridium difficile causes nosocomial/antibiotic-associated diarrhoea and pseudomembranous colitis. The major virulence factors are toxin A and toxin B (TcdB), which inactivate GTPases by monoglucosylation, leading to cytopathic (cytoskeleton alteration, cell rounding) and cytotoxic effects (cell-cycle arrest, apoptosis). C. difficile toxins breaching the intestinal epithelial barrier can act on underlying cells, enterocytes, colonocytes, and enteric neurons, as described in vitro and in vivo, but until now no data have been available on enteric glial cell (EGC) susceptibility. EGCs are crucial for regulating the enteric nervous system, gut homeostasis, the immune and inflammatory responses, and digestive and extradigestive diseases. Therefore, we evaluated the effects of C. difficile TcdB in EGCs. Rat-transformed EGCs were treated with TcdB at 0.1–10 ng/ml for 1.5–48 h, and several parameters were analysed. TcdB induces the following in EGCs: (1) early cell rounding with Rac1 glucosylation; (2) early G2/M cell-cycle arrest by cyclin B1/Cdc2 complex inactivation caused by p27 upregulation, the downregulation of cyclin B1 and Cdc2 phosphorylated at Thr161 and Tyr15; and (3) apoptosis by a caspase-dependent but mitochondria-independent pathway. Most importantly, the stimulation of EGCs with TNF-α plus IFN-γ before, concomitantly or after TcdB treatment strongly increased TcdB-induced apoptosis. Furthermore, EGCs that survived the cytotoxic effect of TcdB did not recover completely and showed not only persistent Rac1 glucosylation, cell-cycle arrest and low apoptosis but also increased production of glial cell-derived neurotrophic factor, suggesting self-rescuing mechanisms. In conclusion, the high susceptibility of EGCs to TcdB in vitro, the increased sensitivity to inflammatory cytokines related to apoptosis and the persistence of altered functions in surviving cells suggest an important in vivo role of EGCs in the pathogenesis of C. difficile infection.
Electronic supplementary material
The online version of this article (doi:10.1007/s00018-016-2426-4) contains supplementary material, which is available to authorized users.
Keywords: Enteric glial cells (EGCs), Clostridium difficile toxin B (TcdB), Rac1 glucosylation, Cell-cycle arrest, Apoptosis, Proinflammatory cytokines, Glial cell-derived neurotrophic factor (GDNF)
Introduction
Clostridium difficile is the main cause of nosocomial/antibiotic-associated diarrhoea and pseudomembranous colitis [1–5]. The major virulence factors of C. difficile are two large exotoxins, toxin A (TcdA) and toxin B (TcdB), which are similar in structure and action mechanism and principally mediate their effects by inactivating Ras and Rho-GTPases by glucosylation [3–12]. GTPases are master regulators of cytoskeletal maintenance, the cell cycle, apoptosis, cell–cell adhesion and secretions [8, 13–15]. Therefore, their inactivation by C. difficile toxins causes cell function alterations that are responsible for most symptoms of infection. In vitro, both toxins induced a disruption in the actin cytoskeleton assembly, leading to cell retraction, loss of adhesion, and cell rounding, which are cytopathic effects mainly mediated through Rac1 inactivation [3–6, 8, 11, 12, 16]. Although TcdB is generally more potent (~1000-fold) than TcdA [4–7, 17], both are cytotoxic to most cultured cells, triggering caspase-dependent or caspase-independent apoptosis, p53-dependent or p53-independent apoptosis, or necrosis [4–6, 12, 17–28]. Both toxins also possess potent proinflammatory activity by stimulating intestinal epithelial cells, immune cells and neurons to secrete cytokines and chemokines [4–6, 29]. Enteric cells, such as enterocytes, colonocytes and enteric neurons, are susceptible to the adverse effects of C. difficile toxins [4–8, 17–27]. However, until now, no data have been available regarding the susceptibility of enteric glial cells (EGCs) to C. difficile toxins, which can reach deeper layers of the intestinal mucosa after inflammation and the disruption of the colonic epithelial cell barrier [2–6]. EGCs are the major cellular component of the enteric nervous system (ENS) and not only have supportive and neurotrophic functions to enteric neurons but are important in the regulation of gut homeostasis, the immune and inflammatory responses, and digestive and extradigestive diseases [30–36]. EGCs mediate these functions through the following means: (1) the production of proinflammatory mediators and neurotrophins [e.g., glial cell-derived neurotrophic factor (GDNF), nerve growth factor (NGF), etc.] and (2) the ability to act as antigen-presenting cells and respond to bacterial/inflammatory stimuli by modulating the expression of surface EGC proteins, cytokine/chemokine receptors, and the secretion of proinflammatory mediators and neurotrophins [30–34].
Based on the adverse effects of C. difficile toxins on several intestinal cells but the lack of data in EGCs, and because this knowledge could contribute to the management of C. difficile infections, we investigated the effects of TcdB in rat-transformed EGCs [37], which are considered similar to rat primary EGCs [37] and have functional properties similar to human EGCs [38].
Our results demonstrate that in EGCs, TcdB causes Rac-1 glucosylation and cytopathic effects followed by cytotoxic effects.
The cytotoxic effects occurred via caspase-dependent apoptosis which was essentially executed by early caspase-3 and PARP activation with a later caspase-7 activation and ROCK1 overexpression but without mitochondrial involvement. Furthermore, TcdB induced an early cell-cycle arrest in the G2/M phase characterized by cyclin B1/Cdc2 complex inactivation due to an upregulation of p27 and a downregulation of cyclin B1 and Cdc2 phosphorylated at Thr161 and Tyr15.
Most importantly, the stimulation of EGCs with tumour necrosis factor-alpha (TNF-α) plus interferon-gamma (IFN-γ) before, concomitantly or after TcdB rendered EGCs more susceptible to TcdB-induced apoptosis.
In addition, EGCs that survived the cytotoxic effect of TcdB did not recover completely, as showed by persistent Rac1 glucosylation, cell-cycle arrest, and low apoptosis percentage. However, the increased GDNF production suggest self-rescuing mechanisms.
Materials and methods
TcdB
TcdB, isolated from C. difficile, strain VPI10463 was purchased from Enzo Life Sciences (BML-G150-0050; Farmingdale, NY) and reconstituted into a 200 µg/ml stock solution and stored as described in the data sheet.
Cell culture and treatment with TcdB
Rat-transformed EGCs (EGC/PK060399egfr; ATCC® CRL-2690™) [37] were obtained from the ATCC (Manassas, VA, USA) and cultured in Dulbecco’s Modified Eagle’s Medium (DMEM) supplemented with 10% foetal bovine serum (FBS), 2 mM l-glutamine, 100 U/ml penicillin and 100 μg/ml streptomycin (complete medium) at 37 °C with 5% CO2 for no more than 20 passages.
For all experiments, EGCs were released using 0.05% trypsin–EDTA, seeded at a density of 0.5 × 10⁶ cells/well in 2 ml of complete medium on six-well culture plates, and allowed to adhere overnight. Then, the EGCs were treated with TcdB at 0.1, 1 and 10 ng/ml for 1.5, 6, 24 and 48 h at 37 °C with 5% CO2.
EGC rounding after being treated as described above was determined by analysis with inverted Olympus IX51 microscope with a Spot-2 cooled camera.
In some experiments, EGCs pre-treated for 1.5 h with TcdB at 0.1 and 1 ng/ml were stimulated for 24 h with 50 ng/ml TNF-α plus 50 ng/ml IFN-γ (PeproTech, Rocky Hill, NJ, USA).
In some experiments, EGCs were treated with 50 ng/ml TNF-α plus 50 ng/ml IFN-γ (PeproTech), 2 h after, 18 h before, 2 h before, or simultaneously with the TcdB treatment (0.1, 1 ng/ml). Then, cells from all the experimental conditions were recovered at 24 h after the TcdB treatment.
For experiments with caspase inhibitors, 50 μM Boc-Asp(OMe)-fluoromethylketone (BAF, a broad-spectrum caspase inhibitor; Enzo Life Sciences) or 2 μM Z-Asp-Glu-Val-Asp-fluoromethylketone (Z-DEVD-FMK; Enzo Life Sciences) was added to EGCs 1 h before TcdB treatment and incubated with them during the experiments.
For Rac1 inhibitor experiments, (N(6)-[2-[[4-(diethylamino)-1-methylbutyl]amino]-6-methyl-4-pyrimidinyl]-2-methyl-4,6-quinolinediamine trihydrochloride) (NSC23766; TOCRIS, Bristol, UK) was added to the EGCs at 100 and 50 μM for 24 and 48 h.
For all experiments and assays, at different times, TcdB-treated and control EGCs, released as described above, were washed, and cell viability and total cell numbers were determined by a trypan blue dye-exclusion assay.
Immunofluorescence
EGCs (0.5 × 10⁶) were allowed to adhere on coverslips immersed in six-well plates in 2 ml of complete medium overnight. Then, the EGCs were treated with TcdB at 0.1, 1 and 10 ng/ml for 1.5, 6 and 24 h at 37 °C with 5% CO2. After being washed with phosphate-buffered saline (PBS) washes, the cells were fixed for 20 min with 4% paraformaldehyde and permeabilized with 0.1% Triton X-100 for 10 min. Then, and being washed with PBS containing 0.05% Triton X-100 (PBSTr), the cells were incubated in blocking buffer (PBSTr containing 2.5% bovine serum albumin) for 30 min. Then, primary monoclonal antibodies (Abs) mouse anti-glial fibrillary acid protein (GFAP; clone 1B4; 1:100; BD Pharmingen-Biosciences, NJ, USA) or mouse anti-S100β (clone SH-B1; 1:100; Sigma-Aldrich, St. Louis, MO, USA) in blocking buffer were added and incubated with the cells for 1 h. Then, Alexa Fluor 488-labelled goat anti-mouse IgG Abs (Molecular Probes, Eugene, Oregon, USA) were added at a 1:200 dilution to detect GFAP or S100β. Hoechst 33342 (Molecular Probes) was added at 5 μg/ml to counterstain the nuclei. The coverslips were mounted on microscopic glass slides with ProLong Gold antifade medium. All steps were performed at room temperature. Fluorescence was evaluated by a fluorescence microscope equipped with a digital camera.
Cell-cycle and apoptosis evaluation by flow cytometry
At different times, TcdB-treated and control EGCs were recovered and analysed by flow cytometry to evaluate the DNA content and detect apoptosis and cell-cycle changes [39–42].
In brief, after the cells were recovered and washed, the 200 g cell pellets were resuspended in 1 ml of hypotonic fluorochrome solution [propidium iodide (PI) 50 μg/ml in 0.1% sodium citrate plus 0.1% Triton X-100]. The samples were placed overnight in the dark at 4 °C, and the PI fluorescence of individual nuclei was measured using an EPICS XL-MCL flow cytometer (Beckman Coulter, FL, USA) [39].
Apoptosis was analysed as described by Nicoletti et al. [41]. The data were processed by an Intercomp computer and analysed with EXPO32 software (Beckman Coulter).
The cell cycle was analysed by measuring DNA-bound PI fluorescence in the orange-red fluorescence channel (FL2) with linear amplification. The percentage of cells in each cell-cycle phase was analysed with ModFit software (Verity Software House, Topsham, ME, USA) [42].
Western blot analysis
At different times, TcdB-treated and control EGCs were lysed in a modified RIPA buffer supplemented with protease and phosphatase inhibitors (Sigma-Aldrich). Protein content was determined by a standard Bradford protein assay (Bio-Rad Laboratories, Milan, Italy).
Proteins (20 µg) were separated by 10 or 12% SDS-PAGE and transferred to nitrocellulose membranes, which were blocked and then incubated overnight at 4 °C with primary Abs to the following: Rac1 (clone 23A8), Rac1 (clone 102) and Bak (Upstate, Lake Placid, NY, USA); Bax (N-20) and Bcl-XL (S-18) (Santa Cruz Biotechnology, Santa Cruz, CA, USA); caspase-3, caspase-7, caspase-9, PARP, phospho-Cdc2 (Thr161), phospho-Cdc2 (Tyr15), p27, cyclin B1, ROCK1, PAK and cofilin (Cell Signaling Technology, Beverly, MA, USA); and β-actin (clone AC-15) (Sigma-Aldrich).
Signals were detected using appropriate horseradish peroxidase-conjugated secondary antibodies and the enhanced chemiluminescence system (GE Healthcare, Milan, Italy).
Blots were stripped in stripping buffer (0.2 M NaOH in double-distilled water) for 15 min, and after being washed, the blots were reprobed. The β-actin was used as a loading control.
For the Western blot analysis, the results of one experiment that is representative of four independent experiments are shown. Densitometry analyses were performed after scanning by Quantity One software (Bio-Rad Milan, Italy), the results are expressed as arbitrary units relative to the densitometric units (U) of β-actin, and the values were obtained from four independent experiments. The data were analysed by Student’s t test.
ELISA
GDNF levels were evaluated using a Rat ELISA kit from Boster Biological Technology (Pleasanton, CA, USA). TNF-α, IFN-γ and interleukin-1beta (IL-1β) levels were evaluated using Rat ELISA kits from Elabscience Biotechnology (Wuhan, Hubei, China), according to the manufacturer’s instructions. For these assays, the supernatants from control EGC cultures and those of EGCs treated with TcdB at 0.1–10 ng/ml were recovered at the indicated times, centrifuged and filtered with 0.22-μm filters. GDNF, TNF-α, IFN-γ, and IL-1β titers were calculated relative to standard curves, and the data are reported as pg/ml for 105 cells. The sensitivity of the ELISA kits for GDNF and TNF-α was <4 and <46.88 pg/ml, while that for IFN-γ and IL-1β was <18.75 pg/ml.
Results
Cytopathic effect of TcdB in EGCs
First, to confirm that the rat-transformed EGCs (EGC/PK060399egfr; ATCC® CRL-2690™) [37] obtained from the ATCC effectively expressed the main glial markers, GFAP and S100β, as reported in the data sheet [30–37, 43], the cells were immunolabelled with GFAP (green) or S100β (green) at the indicated times, using Hoechst (blue) to counterstain cell nuclei, and were then imaged using a fluorescence microscope equipped with a digital camera. The immunofluorescence analysis showed that the EGCs were strongly positive for both GFAP (Fig. S1) and S100β (Fig. S1).
Since the most striking morphological changes caused by C. difficile toxins in mammalian cells are retraction and cell rounding (cytopathic effects) [3–6, 8, 12, 16], we investigated whether TcdB could induce cytopathic effects in EGCs. EGCs were treated with TcdB at 0.1–10 ng/ml for 1.5–24 h and then observed using an inverted microscope with a camera.
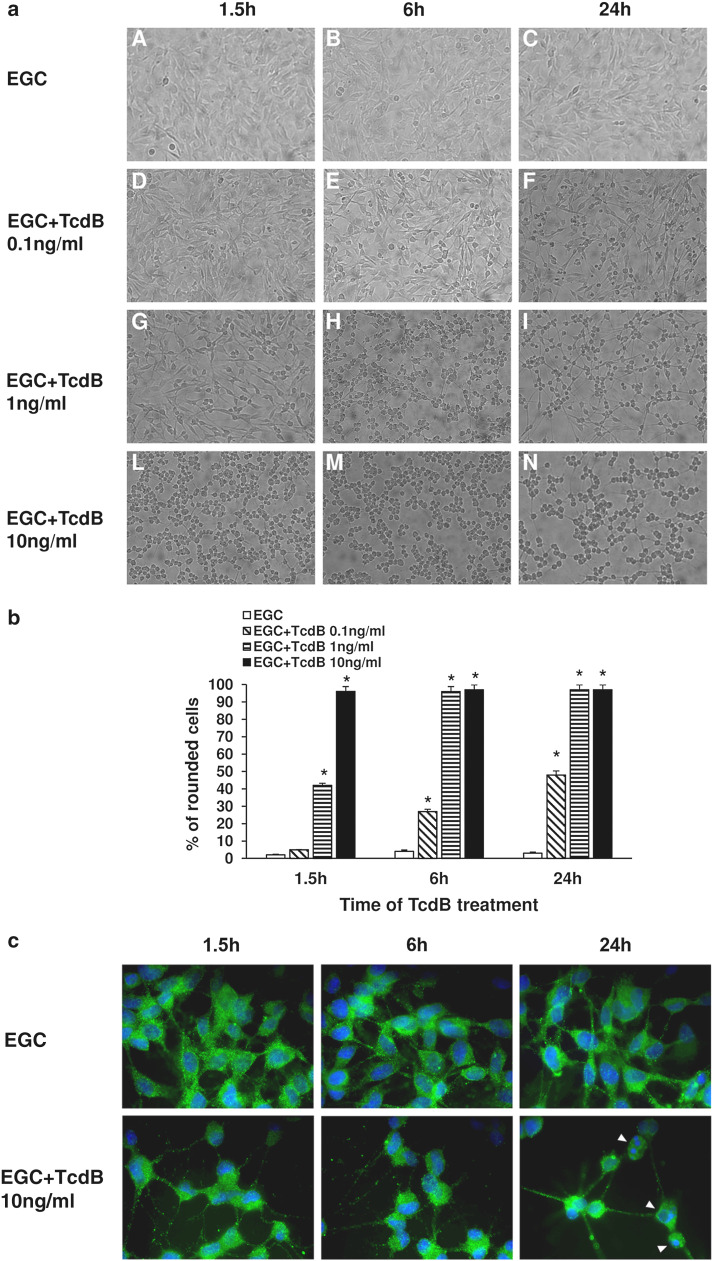
At all times examined, the control EGCs were polygonal with indistinct/invisible intercellular borders (Fig. 1a; images A–C, b). TcdB caused retraction and cell rounding in a dose- and time-dependent manner (Fig. 1a; images F–N, b). In fact, retraction and rounding in the majority of EGCs (96%) was observed at 1.5 h after treatment with TcdB at 10 ng/ml (Fig. 1a; image L, b), at 6 h after treatment with TcdB at 1 ng/ml (Fig. 1a; image H, b), and at 24 h, but these features were only observed in 48% of the cells after treatment with TcdB at 0.1 ng/ml (Fig. 1a; image F, b). Therefore, TcdB induces cytopathic effects in EGCs.
Fig. 1.
TcdB induces cytopathic effects in EGCs. a At the time indicated, control EGCs (images A–C), EGCs treated with 0.1 ng/ml TcdB (images D–F), EGCs treated with 1 ng/ml TcdB (images G–I) and EGCs treated with 10 ng/ml TcdB (images L–N), were analysed by microscopy, and images were captured. Images from one experiment, representative of three independent experiments, are shown. b Quantification of the percentage of rounded cells. At least 100 cells were counted for each experimental condition in three independent experiments. *P < 0.01 TcdB-treated EGCs versus control EGCs. c EGCs untreated or treated with 10 ng/ml TcdB for 1.5–24 h were immunolabelled with GFAP (green), using Hoechst (blue) to counterstain cell nuclei, and imaged using a fluorescence microscope equipped with a digital camera; original magnification, ×1000. Images from one experiment, representative of three independent experiments, are shown. At 24 h after TcdB treatment, several cells displayed condensed/fragmented nuclei (arrowheads)
In addition to analysing cell rounding, we also used immunofluorescence to investigate changes in the cytoskeleton and in GFAP, a key intermediate filament protein and main glial marker [30–37, 43], in EGCs treated with TcdB. The immunofluorescence results showed further evidence of the time-dependent cytopathic effects of TcdB. Representative images of EGCs either untreated or treated with 10 ng/ml TcdB for 1.5–24 h and stained with both Hoechst and an anti-GFAP antibody are shown in Fig. 1c; TcdB induced cell rounding as well as nuclear condensation and fragmentation in a time-dependent manner (Fig. 1c).
Rac1 glucosylation by TcdB in EGCs
TcdB-induced actin cytoskeleton disruption is a consequence of the Rho protein glucosylation at the specific Thr37 (RhoA) or Thr35 (Cdc42 and Rac1) residues [4–6, 8–12]. Since the kinetics of TcdB-catalysed Rac and Rho glucosylation are almost identical [4–6, 8–10], using Western blot to analyse non-glucosylated Rac1 is ideal for assessing the intracellular action of TcdB [9, 10].
Therefore, we investigated Rac1 glucosylation by Western blot in lysates from control EGCs and EGCs treated with TcdB (0.1–10 ng/ml) for 1.5–48 h using an antibody that recognizes non-glucosylated Rac1 (anti-Rac1 clone 102) [9, 10].
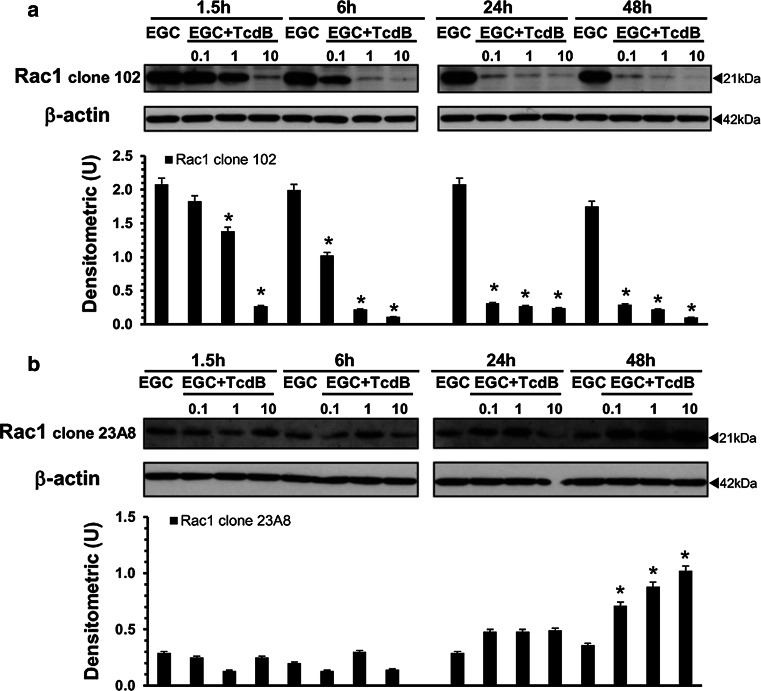
TcdB induced a reduced recognition of Rac1 by anti-Rac1 clone 102 in a dose- and time-dependent manner (Fig. 2a), indicative of Rac1 glucosylation [9, 10]. In particular, TcdB at 10 ng/ml induced approximately 90% Rac1 glucosylation at 1.5 h (Fig. 2a), while TcdB at 1 and 0.1 ng/ml caused approximately 90% Rac1 glucosylation at 6 and 24 h, respectively (Fig. 2a). Moreover, once obtained, the glucosylation levels remained unchanged until 48 h (Fig. 2a).
Fig. 2.
TcdB induces Rac1 glucosylation in EGCs. Lysates from control EGCs and EGCs treated with TcdB (0.1–10 ng/ml) prepared at 1.5–48 h were subjected to SDS-PAGE. The filters were: a probed with anti-Rac1 clone 102, then stripped and probed with anti-β-actin; b cut to around 30 kDa and the bottom sections were probed with anti-Rac1 clone 23A8 and top sections were probed with anti-β-actin. The graphs represent the densitometric analysis of each protein relative to β-actin. *P < 0.01 TcdB-treated EGCs versus control EGCs
To demonstrate that the Rac1 reduction was not due to degradation, we used the anti-Rac1 clone 23A8 antibody, which recognizes both glucosylated and unmodified Rac1 [9, 10].
The Rac1 expression levels were not reduced at any time or TcdB concentration examined (Fig. 2b). Rather, our results showed that the Rac1 expression levels significantly increased until 48 h in a dose-dependent manner (Fig. 2b). Currently, we do not know the mechanisms responsible for the increase in Rac1 expression. It is likely that in our model, similar to that described by the Genth et al. [9–11, 44], the glucosylation of Rac1 affects its proteasomal degradation.
Taken together, these data indicate that TcdB induces strong Rac1 glucosylation in EGCs and because the kinetics of Rac1 glucosylation (Fig. 2) are similar to those of the cytopathic effects (Fig. 1), they seem closely correlated.
TcdB decreases both cell viability and total EGC number
To evaluate whether TcdB induces cytotoxic effects in EGCs, we first examined the viability and total cell number of EGCs treated with TcdB (0.1–10 ng/ml) for 1.5–48 h using trypan blue.
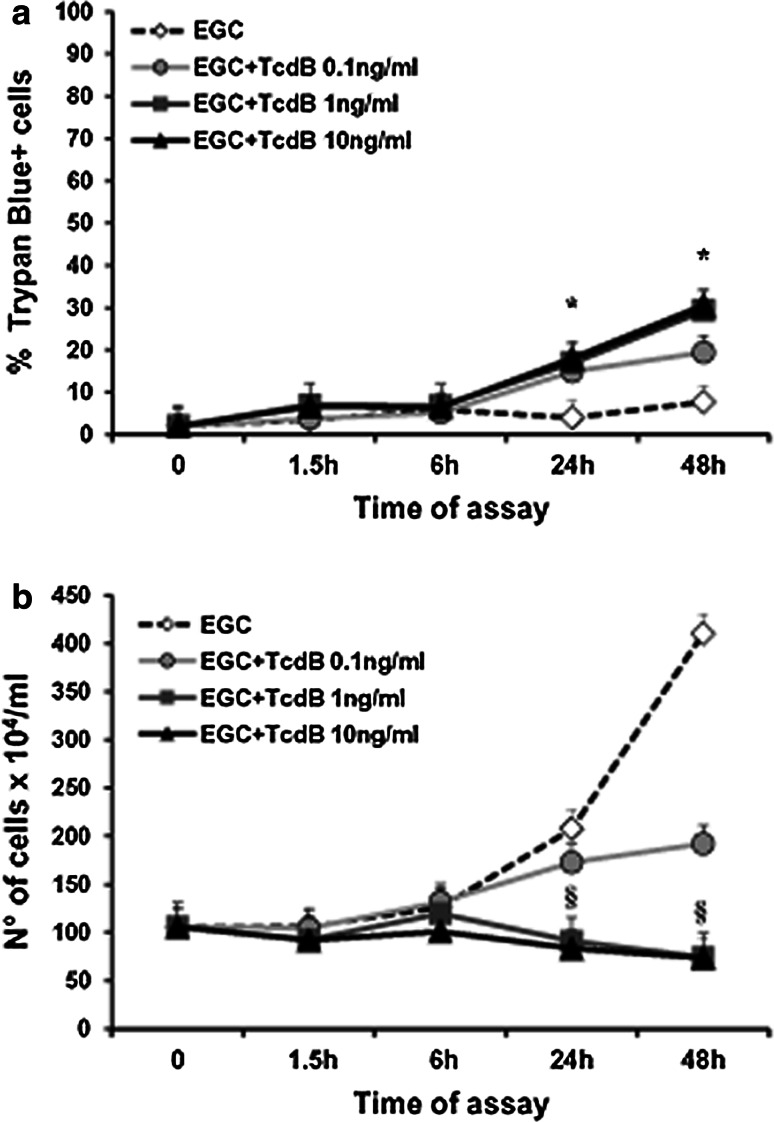
The viability and total number of EGCs treated with TcdB at 1 and 10 ng/ml progressively declined until 48 h, with a maximum reduction in viability of 32% (Fig. 3a, b).
Fig. 3.
Effect of TcdB on EGC viability and cell death. Control EGCs and EGCs treated with TcdB (0.1–10 ng/ml) were recovered at 1.5–48 h, and the percentage of trypan blue+ cells (a) or the total cell number (b) was determined using trypan blue. Data are the mean ± standard deviation of six experiments performed in triplicate. *P < 0.01 TcdB-treated EGCs versus control EGCs, Student’s t test. § P < 0.01 TcdB-treated EGCs at 24 or 48 h versus control EGCs at time 0, Student’s t test
TcdB induces cell-cycle arrest in EGCs
Since the decrease in cell viability could result from cell proliferation arrest and/or apoptosis [45, 46], we first examined the cell-cycle distribution of EGCs by flow cytometry following TcdB treatment.
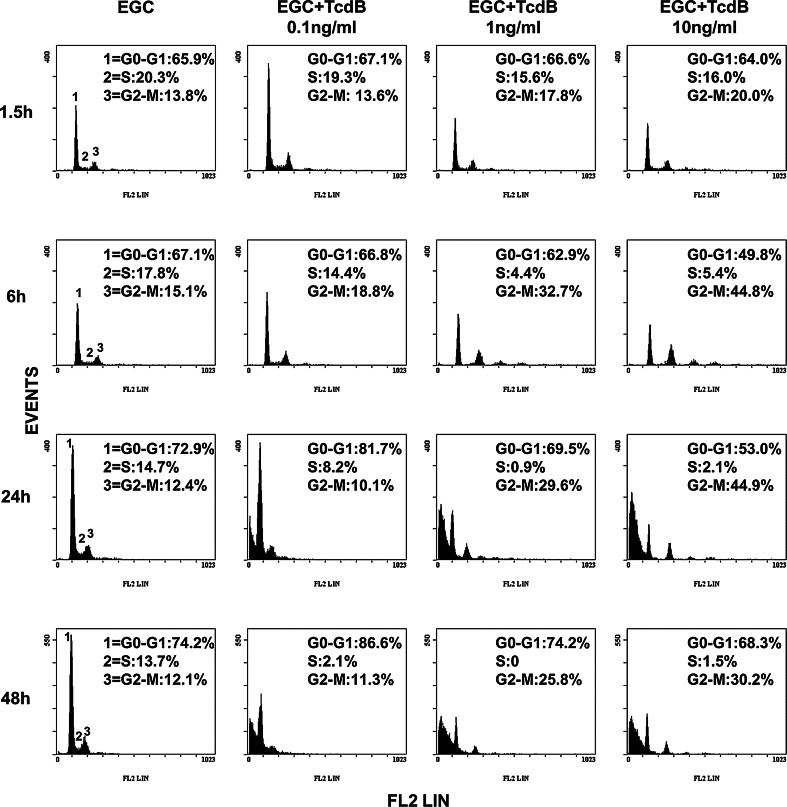
TcdB induced an accumulation of cells in the G2/M phase of the cell cycle in a dose- and time-dependent manner, accompanied by a decrease in the number of cells in the S phase (Fig. 4). At 6 h, the percentage of control cells and those treated with TcdB at 0.1 ng/ml in G2/M was approximately 15 and 19%, respectively, and the percentage increased to 33 and 45% after treatment with TcdB at 1 and 10 ng/ml (Fig. 4). At 24 h, the percentage of cells in G2/M after treatment with TcdB at 1 and 10 ng/ml did not change significantly with respect to that at 6 h (Fig. 4). At 48 h, the percentage of cells in G2/M after treatment with TcdB at 1 and 10 ng/ml was reduced, respectively, by approximately 20 and 33% with respect to that at 6 h, with a concomitant increase in the number of cells in G0/G1, respectively, of approximately 17 and 37% (Fig. 4). At 0.1 ng/ml, TcdB always induced cell-cycle arrest, but it was evident at 24 h and was characterized by an accumulation of cells in the G0/G1 phase (Fig. 4).
Fig. 4.
TcdB induces G2/M cell-cycle arrest in EGCs. Control EGCs and EGCs treated with TcdB (0.1–10 ng/ml) were recovered at 1.5–48 h. The analysis of the cell percentages in the cell-cycle phases was determined by flow cytometry with ModFit software. Cell percentages in G0/G1, S and G2/M are reported. The results of one experiment representative of six are shown
These results indicate that the growth inhibition of EGCs induced by TcdB is associated with the induction of cell-cycle arrest.
To understand the mechanisms of TcdB-induced cell-cycle arrest in EGCs, we used Western blot to investigate the expression of some cell-cycle machinery components that control the G2/M phase [47–50] in EGCs treated with TcdB at 0.1–10 ng/ml for 1.5–48 h.
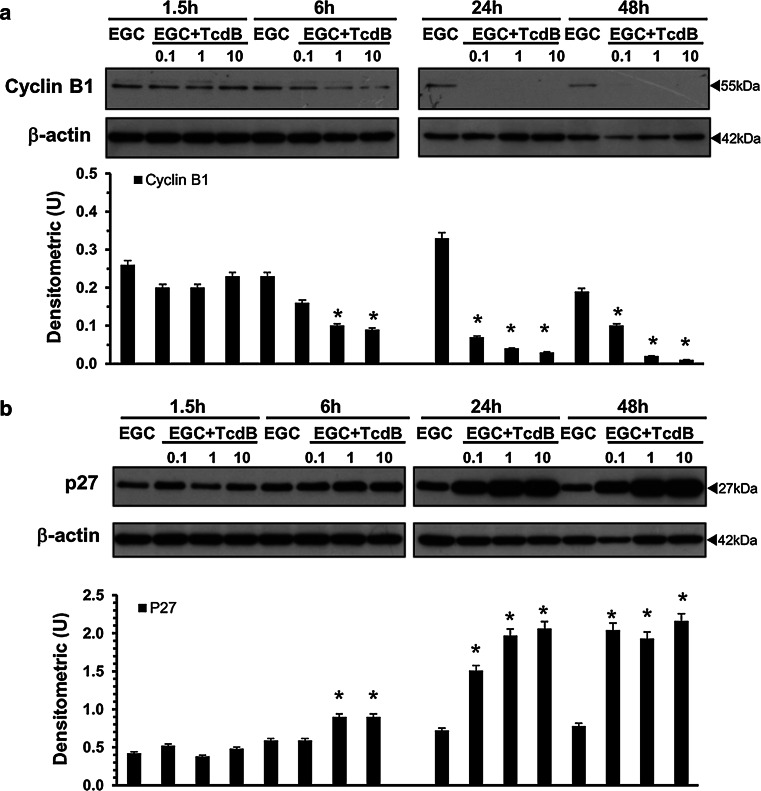
As shown in Fig. 5a, in EGCs treated with TcdB at 1 and 10 ng/ml, the expression of cyclin B1, a major player in the G2/M transition [47–50], was markedly reduced already at 6 h and decreased further at 24 and 48 h (Fig. 5a). Cyclin B1 expression was also downregulated by TcdB at 0.1 ng/ml but only at 24 and 48 h (Fig. 5a).
Fig. 5.
TcdB downregulates cyclin B1 and upregulates p27 expression in EGCs. Lysates from control EGCs and EGCs treated with TcdB (0.1–10 ng/ml) prepared at 1.5–48 h were subjected to SDS-PAGE. The filters were probed with: a anti-cyclin B1 then stripped and probed with anti-β-actin; b anti-p27 then stripped and probed with anti-β-actin. The graphs represent the densitometric analysis of each protein relative to β-actin. *P < 0.01 TcdB-treated EGCs versus control EGCs
The expression of p27, a key cyclin-dependent kinase (CDK) inhibitor protein [47–50], began to increase at 6 h after treatment with TcdB at 1 and 10 ng/ml, reaching a peak at 24 h (2- and 3-fold increase) and remaining high at 48 h (Fig. 5b). Additionally, after treatment with TcdB at 0.1 ng/ml, p27 expression increased twofold at 24 h and increased further at 48 h (Fig. 5b).
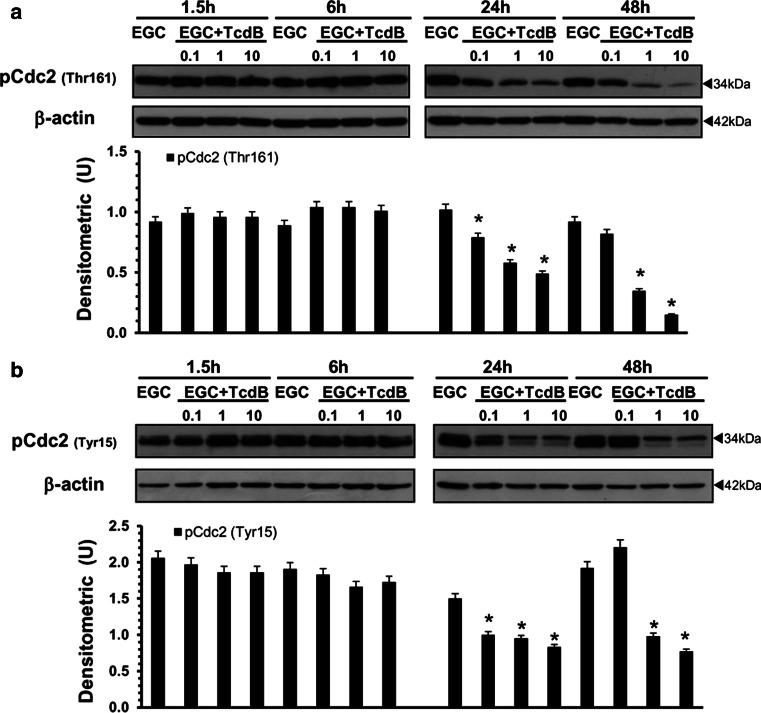
Since cell-cycle progression in G2/M is reported to be related to cell division cycle 2 (Cdc2) kinase activity, negatively regulated by phosphorylation at Thr14 and Tyr15 and positively regulated by phosphorylation at Thr161 [47–50], we next assessed the effect of TcdB on Cdc2 phosphorylation status.
In EGCs treated with TcdB at 1 and 10 ng/ml, the levels of Cdc2 phosphorylated at Thr161 (Fig. 6a) and at Tyr15 (Fig. 6b) showed a strong decrease at 24 h, and Cdc2 phosphorylated at Thr161 further decreased at 48 h (Fig. 6a). In EGCs treated with TcdB at 0.1 ng/ml, the levels of Cdc2 phosphorylated at Thr161 (Fig. 6a) and at Tyr15 (Fig. 6b) decreased at 24 h but returned to the expression levels of control EGCs at 48 h (Fig. 6).
Fig. 6.
TcdB downregulates the expression levels of Cdc2 phosphorylated at Thr161 and at Tyr15 in EGCs. Lysates from control EGCs and EGCs treated with TcdB (0.1–10 ng/ml) prepared at 1.5–48 h were subjected to SDS-PAGE. The filters were probed with: a anti-phospho-Cdc2 (pCdc2) (Thr161) then stripped and probed with anti-β-actin; b anti-phospho-Cdc2 (pCdc2) (Tyr15) then stripped and probed with anti-β-actin. The graphs represent the densitometric analysis of each protein relative to β-actin. *P < 0.01 TcdB-treated versus control EGC
TcdB induces apoptosis in EGCs
Both Rho-GTPase glucosylation and cell-cycle arrest are associated with apoptosis [13–15, 45, 46], as has also been reported for several other cell types, after C. difficile toxin treatment [18, 25]. Therefore, we next examined whether the loss of viability and cell-cycle arrest in EGCs after TcdB treatment led to apoptosis by measuring changes in DNA content via flow cytometry in control EGCs and EGCs treated with TcdB at 0.1–10 ng/ml for 1.5–48 h.
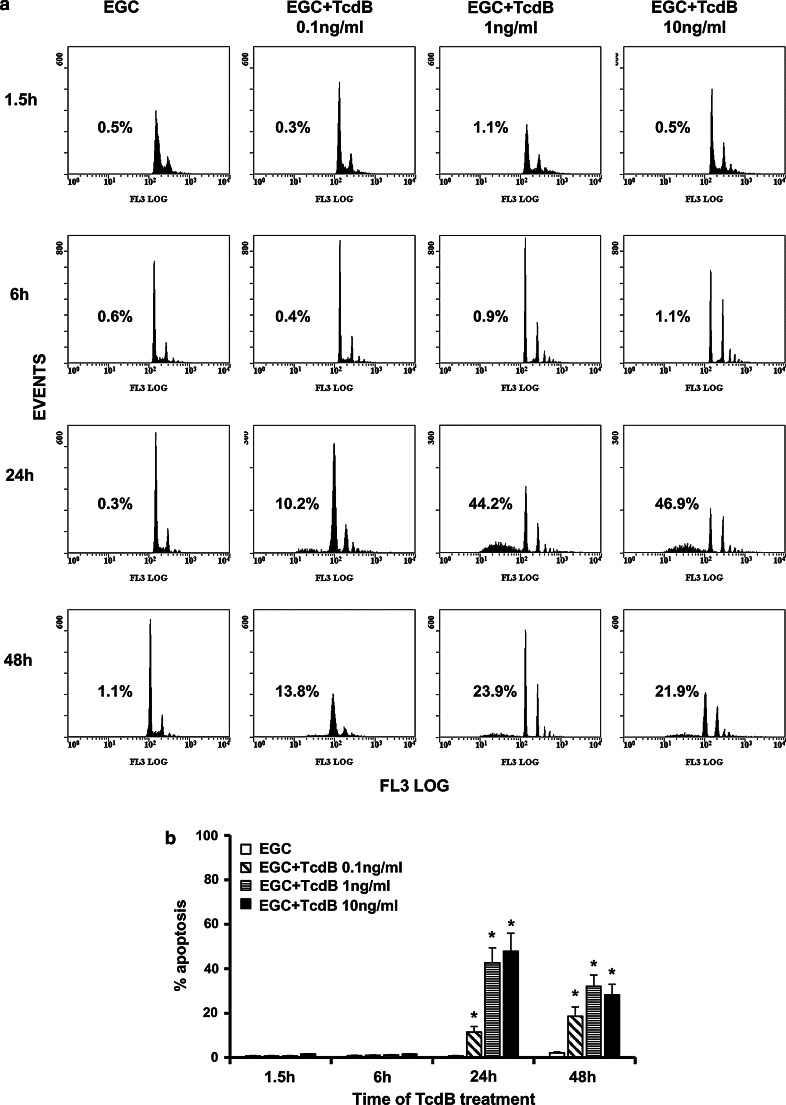
As shown in Fig. 7, TcdB induces apoptosis in EGCs in a dose- and time-dependent manner. In fact, no apoptosis was evident until 24 h (Fig. 7a, b), and at 24 h, the percentage of apoptosis after treatment with TcdB at 0.1, 1 and 10 ng/ml was, respectively, 10.2, 44.2 and 46.9% (Fig. 7a, b).
Fig. 7.
TcdB induces EGC apoptosis. Control EGCs and EGCs treated with TcdB (0.1–10 ng/ml) were recovered at 1.5–48 h. Apoptosis was determined by measuring the percentage of hypodiploid nuclei by flow cytometry. a DNA fluorescence flow cytometric profiles and percentages of hypodiploid nuclei of one experiment, representative of six. b Graph showing the mean ± standard deviation of percentage hypodiploid nuclei obtained in eight different experiments. *P < 0.01 TcdB-treated EGCs versus control EGCs, Student’s t test
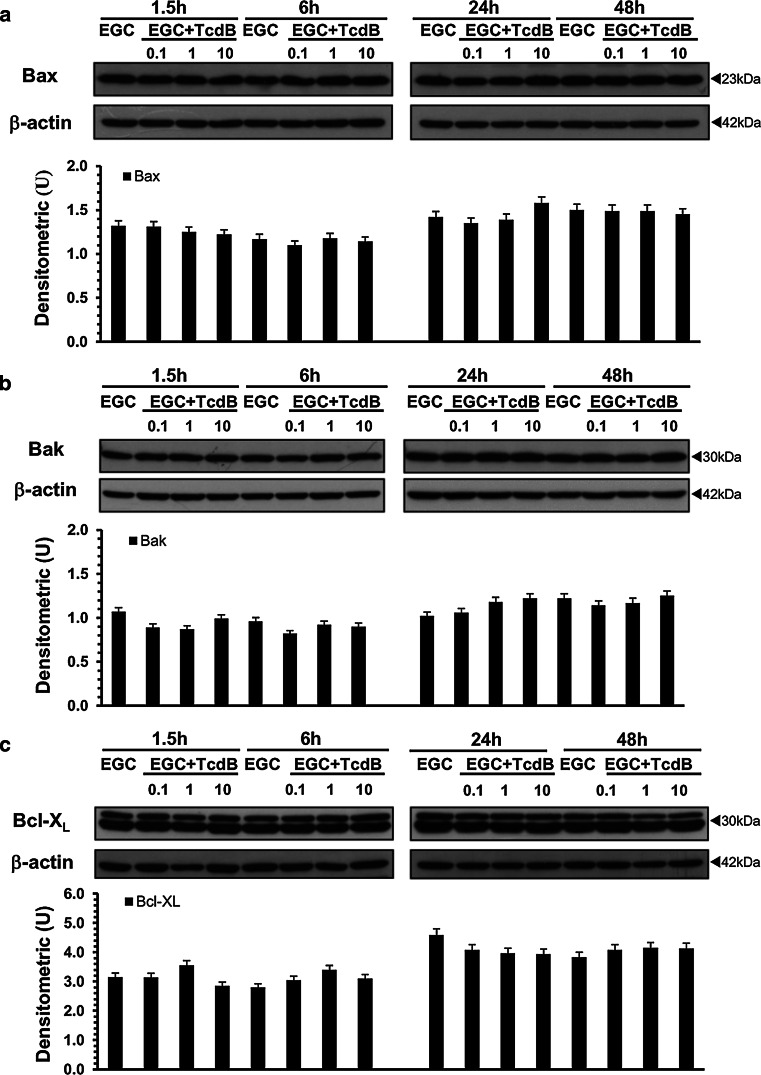
Clostridium difficile toxins, similar to several apoptotic stimuli, mainly induce apoptosis in several cell types by triggering mitochondrial pathways through changes in Bcl-2 family protein expression and caspase-9 activation [4–6, 18, 20, 22–26, 46, 51, 52]. Therefore, to analyse the mechanisms of C. difficile TcdB-induced EGC apoptosis, we evaluated the activation/expression of some pro-apoptotic (Bax, Bak) and anti-apoptotic (Bcl-XL, Bcl-2) Bcl-2 members, as well as caspase-9 activation.
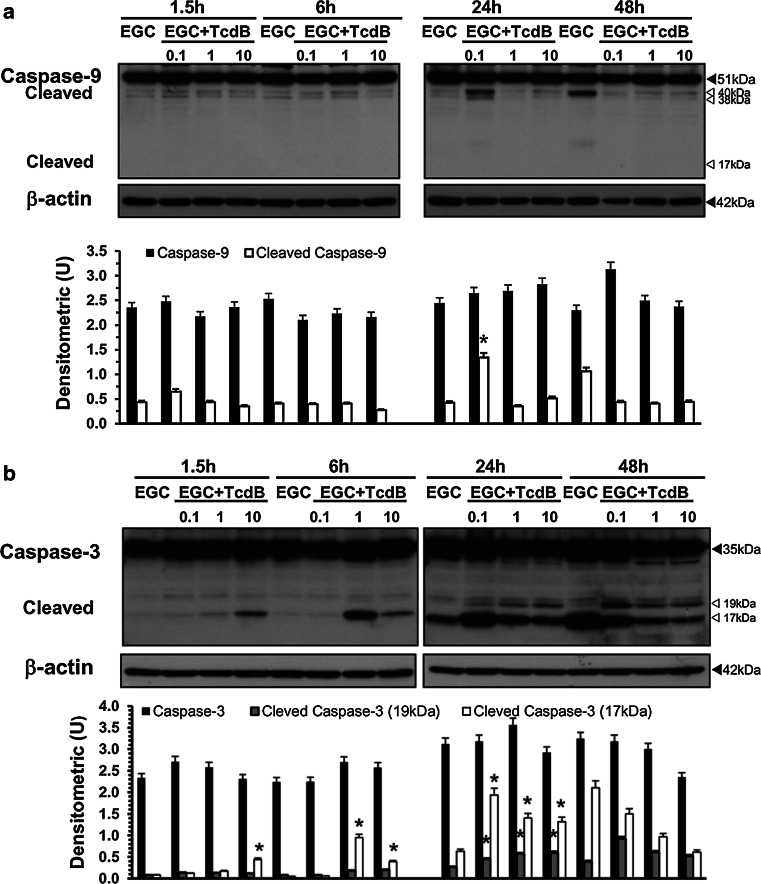
At all the concentrations and times examined, TcdB did not induce changes in the expression/activation of Bax (Fig. 8a), Bak (Fig. 8b), Bcl-XL (Fig. 8c) or Bcl-2 (data not shown). Caspase-9 activation was found only after treatment with TcdB at 0.1 ng/ml at 24 h (Fig. 9a).
Fig. 8.
TcdB did not change Bax, Bak or Bcl-XL expression in EGCs. Lysates from control EGCs and EGCs treated with TcdB (0.1–10 ng/ml) prepared at 1.5–48 h were subjected to SDS-PAGE. The filters were probed with: a anti-Bax then stripped and probed with anti-β-actin; b anti-Bak then stripped and reprobed with anti-β-actin; c anti-Bcl-XL then stripped and probed with anti-β-actin. The graphs represent the densitometric analysis of each protein relative to β-actin
Fig. 9.
TcdB activates caspase-3 but not caspase-9 in EGCs. Lysates from control EGCs and EGCs treated with TcdB (0.1–10 ng/ml) prepared at 1.5–48 h were subjected to SDS-PAGE. The filters were probed with: a anti-caspase-9 then stripped and probed with anti-β-actin; b anti-β-actin then stripped and probed with anti-caspase-3. The graphs represent the densitometric analysis of each protein relative to β-actin. *P < 0.01 TcdB-treated EGCs versus control EGCs
Since apoptosis execution induced by several stimuli and by TcdA and TcdB is mediated mainly by the activation of effector caspases [4–6, 18, 20, 24–28, 46, 51, 52], we analysed caspase-3 and caspase-7 activation, as well as the cleavage of poly (ADP-ribose) polymerase (PARP), a key substrate of effector caspases [51, 52].
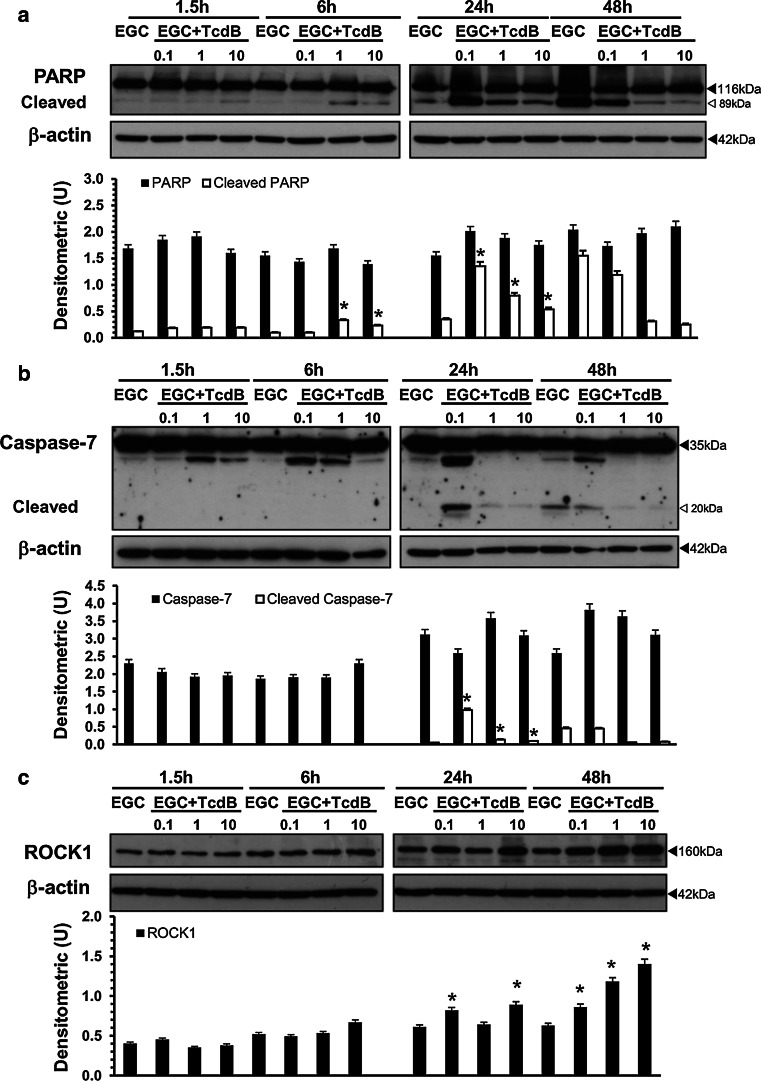
In EGCs, TcdB induces the activation of caspase-3 (Fig. 9b) and caspase-7 (Fig. 10b) and PARP cleavage (Fig. 10a), and the activation kinetics are strongly dependent on the TcdB concentration. In fact, already at 6 h, TcdB at 1 and 10 ng/ml induced a significant cleavage of caspase-3 to the 19 kDa active and 17 kDa fully active fragments and the cleavage of PARP into the 89 kDa active fragment (Figs. 9b, 10a). The active fragments of caspase-3 and PARP increased further at 24 h and decreased at 48 h (Figs. 9b, 10a). A different pattern of activation for caspase-3 and PARP was shown by treatment with TcdB at 0.1 ng/ml: the cleavage of caspase-3 into the 17 kDa active fragment and of PARP into the 89 kDa active fragment was evident only after 24 h and decreased at 48 h (Figs. 9b, 10a), while the 19 kDa caspase-3 fragment was found only at 48 h (Figs. 9b, 10a). Furthermore, the activation of caspase-7 into the 20 kDa active fragment, evident only at 24 h with all TcdB concentrations used, was stronger after treatment with TcdB at 0.1 and weaker after treatment with TcdB at 1 and 10 ng/ml (Fig. 10b).
Fig. 10.
TcdB activates caspase-7 and PARP and upregulates ROCK1 expression in EGCs. Lysates from control EGCs and EGCs treated with TcdB (0.1–10 ng/ml) prepared at 1.5–48 h were subjected to SDS-PAGE. The filters were probed with: a anti-PARP then stripped and probed with anti-β-actin; b anti-caspase-7 then stripped and probed with anti-β-actin; c anti-ROCK1 then stripped and probed with anti-β-actin. The graphs represent the densitometric analysis of each protein relative to β-actin. *P < 0.01 TcdB-treated EGCs versus control EGCs
Since Rho-GTPase glucosylation could affect Rho-associated coiled-coil containing kinase 1 (ROCK1) and p21-activated kinase 1 (PAK1), which converge on proteins that directly regulate the actin cytoskeleton, such as cofilin [13–15, 53], and these downstream effectors could be involved in membrane blebbing and cytoskeletal alteration of apoptosis execution phase [13–15, 51–53], we determined whether TcdB affected the expression of these proteins in EGCs.
The most evident change was the increase in ROCK1 at 24 h after treatment with TcdB at 0.1 and 10 ng/ml, and at 48 h with all TcdB concentrations (Fig. 10c). In contrast, TcdB did not affect the expression of PAK1 or cofilin at any time or concentration used (data not shown).
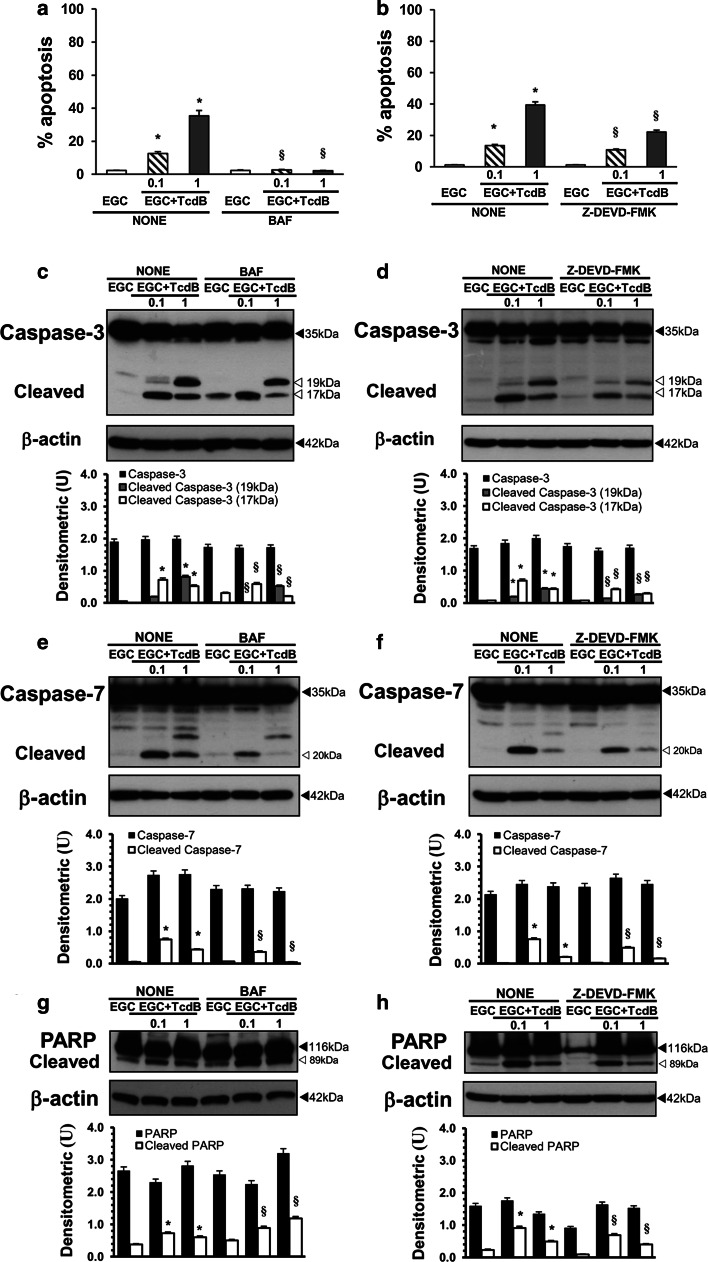
In a further series of experiments to investigate the role of caspases in TcdB-induced apoptosis in EGCs, the effect of BAF (50 μM), a general caspase inhibitor [20, 25–28, 40], and of Z-DEVD-FMK (2 μM), a caspase-3 and caspase-7 inhibitor [20, 25–28, 39, 40], was analysed. For this purpose, we chose the time of 24 h, which gave the maximum effects for both apoptosis and caspase activation, and the TcdB concentrations of 0.1 and 1 ng/ml. EGCs were pre-treated with 50 μM BAF or 2 μM Z-DEVD-FMK for 1 h and exposed to TcdB at 0.1 and 1 ng/ml for 24 h; then, we examined both the percentage of apoptotic cells by flow cytometry and the activation of caspase-3, caspase-7 and PARP by Western blot analysis.
The results showed that apoptosis was abolished by BAF but only partially inhibited by Z-DEVD-FMK (Fig. 11a, b). In fact, 50 μM BAF inhibited TcdB-induced EGC apoptosis by approximately 98% with 1 ng/ml and 84% with 0.1 ng/ml (Fig. 11a). Instead, 2 μM Z-DEVD-FMK inhibited TcdB-induced EGC apoptosis by approximately 44% with 1 ng/ml and 20% with 0.1 ng/ml (Fig. 11b). BAF reduced the cleavage of caspase-3 into the 17 kDa fragment by more than 60% and by approximately 20% after treatment with TcdB at 1 and 0.1 ng/ml, respectively (Fig. 11c), while the cleavage of caspase-7 into the 20 kDa fragment was prevented by treatment with TcdB at 1 ng/ml and reduced by more than 50% by treatment with TcdB at 0.1 ng/ml (Fig. 11e). Interestingly, BAF did not prevent PARP cleavage; rather, BAF significantly increased it by approximately 20% with TcdB at 0.1 ng/ml and by approximately 50% with TcdB at 1 ng/ml (Fig. 11g). Z-DEVD-FMK with both TcdB concentrations reduced the cleavage of caspase-3 into the 17 and 19 kDa fragments and the cleavage of caspase-7 into the 20 kDa fragment by more than 30% (Fig. 11d, f) and reduced the cleavage of PARP into the 89 kDa fragment by approximately 25% with TcdB at 0.1 ng/ml and by approximately 20% with TcdB at 1 ng/ml (Fig. 11h).
Fig. 11.
Effect of caspase inhibitors on TcdB-induced EGC apoptosis and caspase-3, caspase-7 and PARP activation. a EGCs pre-treated for 1 h in the absence or presence of 50 μM BAF were treated with TcdB (0.1, 1 ng/ml) for 24 h. At this time, the cells were recovered, and apoptosis was measured by evaluating the percentage of hypodiploid nuclei via flow cytometry. The data are the mean ± standard deviation of three experiments performed in triplicate. Lysates from untreated EGCs, EGCs pre-treated with 50 μM BAF with or without TcdB treatment (0.1, 1 ng/ml) were prepared at 24 h, subjected to SDS-PAGE, and probed with: anti-caspase-3 then stripped and probed with anti-β-actin (c); anti-caspase-7 then stripped and probed with anti-β-actin (e); anti-PARP then stripped and probed with anti-β-actin (g). The graphs represent the densitometric analysis of each protein relative to β-actin. b EGCs pre-treated for 1 h in the absence or presence of 2 μM Z-DEVD-FMK were treated with TcdB (0.1, 1 ng/ml) for 24 h. At this time, the cells were recovered, and apoptosis was measured by evaluating the percentage of hypodiploid nuclei via flow cytometry. The data are the mean ± standard deviation of three experiments performed in triplicate. Lysates from untreated EGCs, EGCs pre-treated with 2 μM Z-DEVD-FMK with or without TcdB treatment (0.1, 1 ng/ml) were prepared at 24 h, subjected to SDS-PAGE, and probed with: anti-caspase-3 then stripped and probed with anti-β-actin (d); anti-caspase-7 then stripped and probed with anti-β-actin (f); anti-PARP then stripped and probed with anti-β-actin (h). For all the graphs: *P < 0.01 TcdB-treated EGCs versus control EGCs; § P < 0.01 TcdB-treated EGCs pre-treated with inhibitor versus TcdB-treated EGCs not pre-treated with inhibitor
Altogether, these results demonstrate that caspases, caspase-3 and caspase-7 in particular, have a central role in TcdB-induced EGC apoptosis but only a marginal role in PARP cleavage.
Pharmacological inhibition of Rac1 in EGCs
The cytopathic effects of C. difficile toxins are mainly mediated by their Rho-GTPase glucosylation activity, but cytotoxic effects could be induced also by glucosylation-independent events [4–6, 11, 12, 22–25, 54]. Therefore, to analyse whether the induction of cytopathic and cytotoxic effects in EGCs by TcdB is mainly the consequence of inactivation of Rac1, we performed experiments with a pharmacological inhibitor of Rac1, NSC23766 [55–57]. EGCs were treated with 100 and 50 μM NSC23766 for 24 and 48 h and then recovered for in vitro assays.
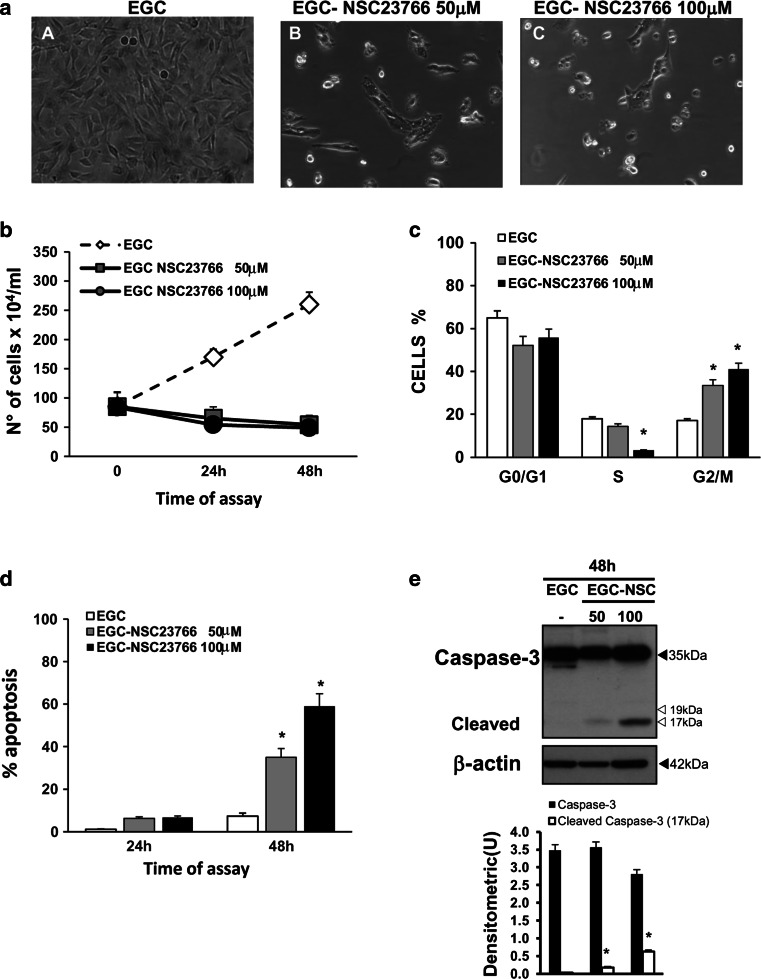
The results showed that after 24 h, the inhibition of Rac1 with NSC23766 led to cell body retraction and cell rounding in approximately 90% of cells (Fig. 12a; images B, C). The total cell number progressively declined until 48 h with a maximum reduction of 42% (Fig. 12b), indicating that Rac1 inhibition with NSC23766 induced cell-cycle arrest (Fig. 12b, c). In fact, the percentage of cells in G2/M was approximately 17% in control cells and increased to 33% after treatment with NSC23766 at 50 μM and to 41% after treatment with NSC23766 at 100 μM (Fig. 12c). Furthermore, the increase in the number of G2/M cells after treatment with NSC23766 at 100 μM was accompanied by a concomitant strong decrease (≈80%) in the number of cells in the S phase (Fig. 12c). Rac1 inhibition with NSC23766 also induced apoptosis in EGCs, as demonstrated by the following: (1) 59 and 35% cells with hypodiploid DNA at 48 h after treatment with 100 and 50 μM NSC23766, respectively (Fig. 12d); and (2) the activation of caspase-3 at 48 h in a dose-dependent manner (Fig. 12e).
Fig. 12.
Pharmacological inhibition of Rac1 in EGCs. a Effect of Rac1 inhibitor on cell rounding. At the time indicated, control EGCs at 24 h (image A), EGCs treated with 50 μM NSC23766 for 24 h (image B), and EGCs treated with 100 μM NSC23766 for 24 h (image C) were analysed by microscopy, and images were captured. Images of one experiment representative of three independent experiments are shown. b–d Control EGCs and EGCs treated with 50 or 100 μM NSC23766 were recovered at 24 and 48 h and b the total cell number was determined by trypan blue; c the cell percentages in the cell-cycle phases G0/G1, S and G2/M were determined by flow cytometry with ModFit software and d apoptosis was measured by evaluating the percentage of hypodiploid nuclei via flow cytometry. For all the graphs, data are the mean ± standard deviation of three experiments performed in triplicate. *P < 0.01 NSC23766-treated EGCs versus control EGCs. e Lysates from control EGCs and EGCs treated with 50 or 100 μM NSC23766 prepared at 48 h were subjected to SDS-PAGE and probed with anti-caspase-3 then stripped and probed with anti-β-actin. The graphs represent the densitometric analysis of each protein relative to β-actin. *P < 0.01 NSC23766-treated EGCs versus control EGCs
These data showed that the inhibition of Rac1 in EGCs both with a Rac1 inhibitor (NSC23766) and TcdB led to cell rounding, cell-cycle arrest, caspase-3 activation and apoptosis, but the induction kinetics were different. In fact, with 1 and 10 ng/ml TcdB, cell rounding, cell-cycle arrest, caspase-3 activation and apoptosis were induced between 1.5 and 24 h, while with 50 and 100 μM NSC23766, they were induced between 24 and 48 h. However, similar to TcdB, which inhibits Rac1 activity by its glucosylation, Rac1 inhibition by NSC23766 leads to cytopathic effects and apoptosis.
Cytokines increased the susceptibility of EGCs to TcdB-induced apoptosis
TcdA and TcdB lead to proinflammatory activity by stimulating enterocytes, immune cells and neurons to secrete cytokines and chemokines [4–6, 29]. Therefore, cells localized in the intestinal wall, including EGCs, during C. difficile infection are subjected to strong stimulation by inflammatory cytokines, such as IL-1β, TNF-α and IFN-γ, and EGCs are likely to encounter cytokines secreted by enterocytes/immune cells/neurons during C. difficile infection before coming in contact with TcdB [2–6, 29, 58–60]. Several studies on the effects of these cytokines in EGCs have described the glial cells as cells highly resistant to apoptosis induced by IFN-γ, TNF-α, IL-1β, IL-6 alone or in combinations, such IL-1β plus IL-6 [30–34, 43, 60, 61].
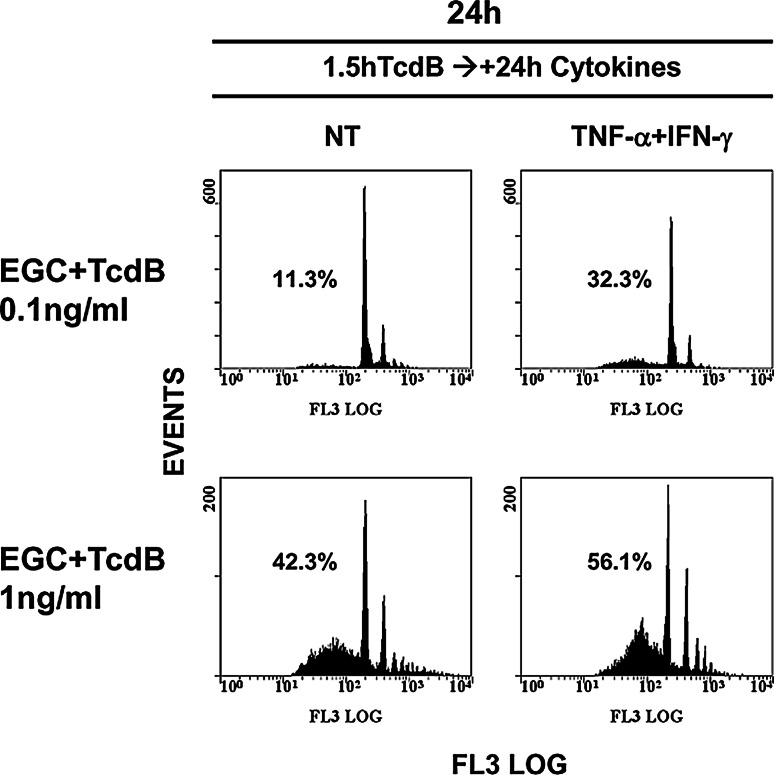
Since it is not known how EGCs respond to inflammatory cytokines while interacting with C. difficile toxins or whether the cytokines present in the microenvironment, e.g., produced in the early infection phase by enterocytes/immune cells/neurons, could affect the susceptibility of EGCs to C. difficile toxins, we investigated these aspects. First, we analysed how EGCs respond to inflammatory cytokines after treatment with C. difficile toxins. For this purpose, EGCs pre-treated for 1.5 h with TcdB at 0.1 and 1 ng/ml were stimulated for 24 h with 50 ng/ml TNF-α plus 50 ng/ml IFN-γ, and apoptosis was evaluated by flow cytometry.
The results showed that cytokines increased the percentage of apoptotic cells by approximately threefold in EGCs treated with TcdB at 0.1 ng/ml and by approximately 1.3-fold in EGCs treated with TcdB at 1 ng/ml compared with TcdB-treated EGCs not stimulated with cytokines (Fig. 13).
Fig. 13.
TNF-α plus IFN-γ added to EGCs after TcdB treatment increase EGC susceptibility to TcdB-induced apoptosis. EGCs pre-treated with TcdB (0.1, 1 ng/ml) for 1.5 h stimulated or not with 50 ng/ml TNF-α plus 50 ng/ml IFN-γ for 24 h were recovered at 24 h. Apoptosis was determined by measuring the percentage of hypodiploid nuclei via flow cytometry; the numbers of hypodiploid nuclei are reported as percentages. The results of one experiment, representative of six, are shown
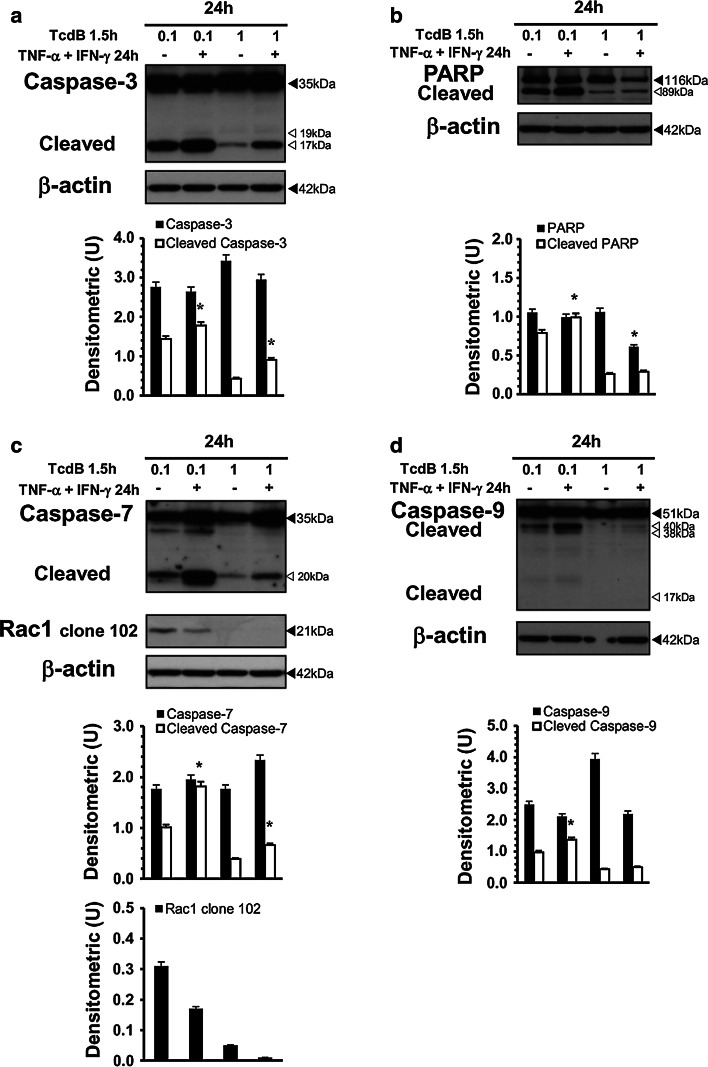
To evaluate whether this increased susceptibility was due to changes in the expression/activation of key pro-apoptotic pathway proteins, we investigated the expression levels of Bax, Bcl-XL, caspase-3, caspase-7 and caspase-9, as well as PARP activation, by Western blot analysis. Rac1 glucosylation was also analysed.
The results showed that increased TcdB-induced apoptosis by TNF-α plus IFN-γ correlated with increased activation of caspase-3, caspase-7, caspase-9 and PARP (Fig. 14a–d), while Bax and Bcl-XL expression was not significantly changed (data not shown). Rac1 glucosylation persisted and was not affected by cytokines (Fig. 14c).
Fig. 14.
TNF-α plus IFN-γ added to EGCs after TcdB treatment increase caspase-3, caspase-7 and PARP activation. Lysates from EGCs pre-treated with TcdB (0.1, 1 ng/ml) for 1.5 h stimulated or not with 50 ng/ml TNF-α plus 50 ng/ml IFN-γ for 24 h were prepared at 24 h and subjected to SDS-PAGE. The filter was probed with: a anti-β-actin then stripped and probed with anti-caspase-3, b anti-PARP then stripped and probed with anti-β-actin, c anti-caspase-7, then after stripping was cut to around 30 kDa and the bottom section probed with anti-Rac1 clone 102 while the top with anti-β-actin. The graphs represent the densitometric analysis of each protein relative to β-actin. *P < 0.01 TcdB-treated EGCs stimulated versus TcdB-treated, non-stimulated EGCs
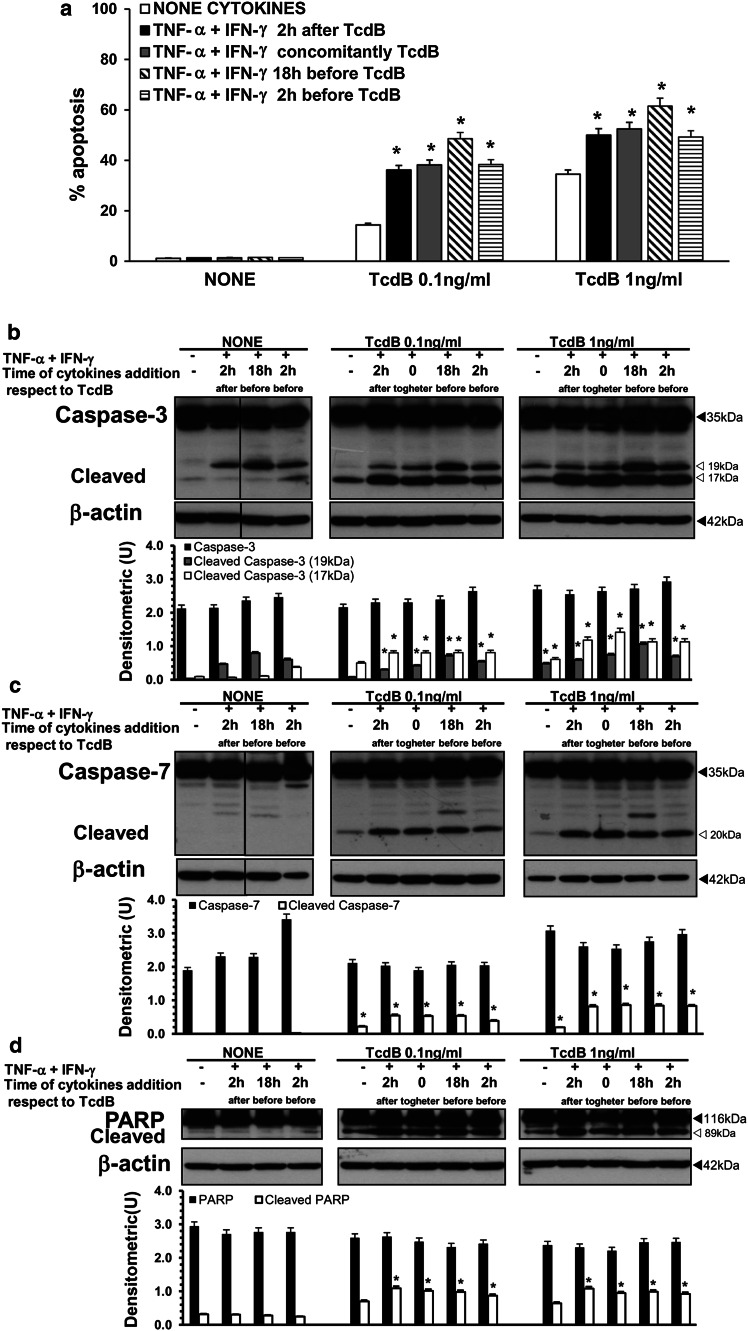
In the light of the above demonstration that the addition of TNF-α plus IFN-γ to TcdB-treated EGCs increased apoptosis, since in vivo EGCs are likely to encounter cytokines secreted by enterocytes/immune cells/neurons before TcdB [2–6, 29, 58–60], we investigated the effect of pre-treatment with cytokines or their simultaneous addition with TcdB. EGCs were treated with 50 ng/ml TNF-α plus 50 ng/ml IFN-γ before (18 or 2 h) or simultaneously with TcdB treatment (0.1, 1 ng/ml). Then, cells from all the experimental conditions were recovered at 24 h after TcdB treatment and were evaluated in terms of the following: (1) the percentage of apoptotic cells by flow cytometry; (2) caspase-3 and caspase-7 expression and PARP activation by Western blot analysis; and (3) Bax and Bcl-XL expression by Western blot analysis.
The results showed that the TcdB-induced EGC apoptosis was increased by TNF-α plus IFN-γ independently of the time of cytokine addition (Fig. 15a), although there was a trend towards a major increase in TcdB-induced apoptosis when EGCs were exposed to TNF-α plus IFN-γ 18 h before TcdB treatment. In fact, cytokine stimulation 2 h after, 2 h before and concomitantly with TcdB treatment increased the percentage of apoptotic cells by approximately 2.6-fold in EGCs treated with 0.1 ng/ml TcdB and by approximately 1.4-fold with 1 ng/ml TcdB compared with TcdB-treated EGCs not stimulated with cytokines (Fig. 15a). However, cytokine stimulation 18 h before TcdB treatment increased the percentage of apoptotic cells by approximately 3.3-fold with 0.1 ng/ml TcdB and 1.8-fold with 1 ng/ml TcdB (Fig. 15a). The Western blot analysis results confirmed that the TcdB-induced apoptosis increased by adding cytokines before and concomitantly with TcdB correlated with an increased activation of caspase-3 (cleavage into the 17 and 19 kDa fragments) and caspase-7 (cleavage into the 20 kDa fragment) and PARP cleavage into the 89 kDa fragment (Fig. 15b–d). Bax and Bcl-XL expression was not significantly changed (data not shown). Rac1 glucosylation by TcdB persisted and was not affected by cytokines (data not shown).
Fig. 15.
TNF-α plus IFN-γ added to EGCs at various times with respect to TcdB treatment increase EGC susceptibility to TcdB-induced apoptosis via caspase-3, caspase-7 and PARP activation. EGCs were treated with 50 ng/ml TNF-α plus 50 ng/ml IFN-γ: (1) 2 h after, (2) concomitantly, (3) 18 h before, and (4) 2 h before TcdB treatment (0.1, 1 ng/ml). EGCs not treated with TcdB but treated with 50 ng/ml TNF-α plus 50 ng/ml IFN-γ in the same conditions were control EGCs. Cells from all the experimental conditions were recovered at 24 h after being treated or not with TcdB for the evaluation of apoptosis (a) and the preparation of lysates, SDS-PAGE and Western blot analysis (b–d). a Apoptosis was determined at 24 h by measuring the percentage of hypodiploid nuclei via flow cytometry. The data are the mean ± standard deviation of six experiments performed in triplicate. *P < 0.01 TcdB-treated, stimulated EGCs versus TcdB-treated, non-stimulated EGCs. For Western blot analysis the filters were probed with: b anti-caspase-3 then stripped and probed with anti-β-actin; c anti-caspase-7 then stripped and probed with anti-β-actin; d anti-PARP then stripped and probed with anti-β-actin. The vertical lines in the blots indicate repositioned gel lanes. The graphs represent the densitometric analysis of each protein relative to β-actin. *P < 0.01 TcdB-treated, stimulated EGCs versus TcdB-treated, non-stimulated EGCs
Both C. difficile toxins cause proinflammatory activity by stimulating several cell types to secrete cytokines and chemokines [4–6, 29]. To evaluate whether EGCs also secrete proinflammatory cytokines in response to TcdB, we performed ELISA tests for TNF-α, IFN-γ, and IL-1β (ELISA kits, Elabscience) in supernatants recovered from cultures of EGCs treated with TcdB (0.1–10 ng/ml) for 1.5–48 h. The results showed that at all times and TcdB concentrations examined, control EGCs and TcdB-treated EGCs did not secrete amounts of TNF-α, IFN-γ, or IL-1β detectable by the ELISA kits used (data not shown). The minimum detectable levels of the ELISA kits used were 46.88 pg/ml for TNF-α and 18.75 pg/ml for IFN-γ and IL-1β.
Persistence of molecular and functional alterations in TcdB-treated EGCs
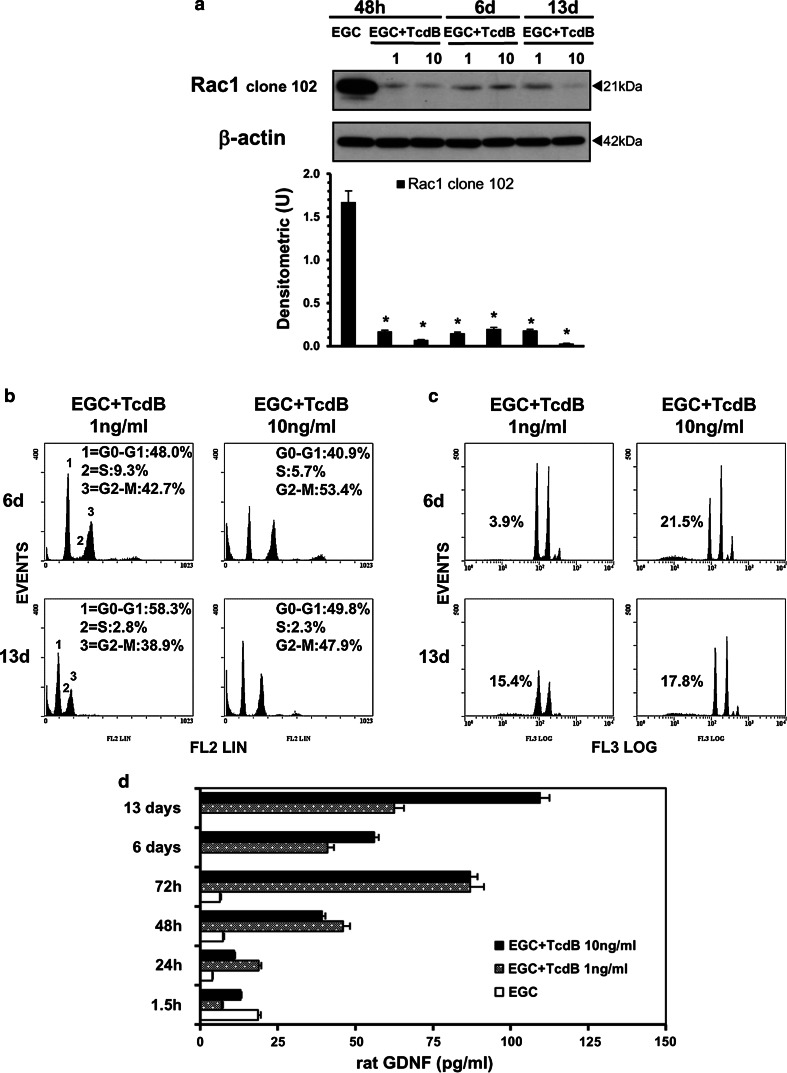
The above results demonstrated that after treatment with TcdB at 1 and 10 ng/ml, between 40 and 50% of EGCs survived. To investigate whether some effects induced by TcdB persisted in these EGCs, the cells were treated with TcdB at 1 and 10 ng/ml for 48 h. At this time, the supernatants were removed and replaced with fresh complete medium; then, the surviving EGCs were further incubated for 6 (48 h plus 4 days) or 13 days (48 h plus 11 days). At 6 and 13 days, the cells were recovered and examined in terms of the following: (1) Rac1 glucosylation; (2) cell-cycle changes; (3) viability and apoptosis; and (4) GDNF secretion.
The results indicated that in EGCs that survived TcdB after 6 and 13 days, Rac1 glucosylation (Fig. 16a) and cell-cycle arrest (Fig. 16b) were still present, and the cell viability and cell number were maintained as they were at 48 h (Table 1). The percentage of hypodiploid DNA was low, ranging between 3.9 and 21% (Fig. 16c). Furthermore, these cells secreted higher levels of GDNF (Fig. 16d); with respect to the 1.5 h results, the GDNF levels were increased by approximately 2.5-fold at 48 h and 6 days in EGCs treated with 1 and 10 ng/ml TcdB and increased by sixfold at 13 days in EGCs treated with 10 ng/ml TcdB (Fig. 16d). Thus, EGCs that survive the cytotoxic effects of TcdB do not recover completely but increase their production of GDNF.
Fig. 16.
TcdB causes persistent alterations in EGCs. Control EGCs or EGCs treated with TcdB (1, 10 ng/ml) at 48 h were washed to remove TcdB and were then incubated for 6 or 13 days. The cells or supernatants were recovered, a at 48 h, 6 or 13 days for the preparation of cell lysates and Western blot analysis of Rac1 glucosylation. The graph represents the densitometric analysis of Rac1 relative to β-actin. *P < 0.01 TcdB-treated EGCs at different times versus control EGCs at 48 h; b at 6 or 13 days to evaluate the cell percentages in cell-cycle phases by flow cytometry (the results of one experiment, representative of four for each time, are shown); c at 6 days or 13 days to evaluate the percentage of hypodiploid nuclei via flow cytometry (the results of one experiment, representative of four for each time, are shown); d at 1.5–72 h, 6 or 13 days to evaluate GDNF secretion in culture supernatants by ELISA. The data are the mean ± standard deviation of three experiments performed in triplicate
Table 1.
Viability and total number of EGCs at 6 and 13 days after TcdB treatment
| Treatmenta | No. of cells × 104/mlb | % Trypan blue + cellsb |
|---|---|---|
| EGC-NT 48 h | 410.3 (±12.7) | 7.7 (±1.2) |
| EGC-TcdB 1 ng/ml 48 h | 76.9 (±5.7) | 27.8 (±3.1) |
| EGC-TcdB 10 ng/ml 48 h | 74.1 (±4.9) | 29.8 (±3.3) |
| EGC-TcdB 1 ng/ml 6 days | 69.1 (±5.8) | 14.8 (±1.4) |
| EGC-TcdB 10 ng/ml 6 days | 70.3 (±4.7) | 20.9 (±1.9) |
| EGC-TcdB 1 ng/ml 13 days | 74.1 (±5.3) | 23.4 (±2.2) |
| EGC-TcdB 10 ng/ml 13 days | 65.4 (±3.6) | 27.3 (±2.8) |
The data are the mean ± standard deviation of four experiments performed in triplicate
aControl EGCs or EGCs treated with TcdB at 1 and 10 ng/ml at 48 h were washed to remove TcdB and were recovered or incubated for 6 or 13 days
bAt 48 h, 6 or 13 days, the cells were recovered as described in the “Materials and methods”, and the total cell number and cell viability were determined using trypan blue
Discussion
Clostridium difficile causes pseudomembranous colitis characterized by epithelial destruction and profound mucosal inflammation [1–7, 17, 29]. Because C. difficile toxins are large, it has been suggested that the toxins in vivo must first act on and disrupt the colonic epithelial cells to induce intestinal inflammation and allow toxins to access cells of the underlying lamina propria and submucosa [1–7, 17–26, 29]. No information is available on the actions of C. difficile toxins on EGCs. Since EGCs have a central role in regulating the ENS, gut homeostasis, the immune and inflammatory responses, and digestive and extradigestive diseases [30–36], their possible susceptibility to cytopathic and cytotoxic effects by C. difficile toxins, particularly TcdB, which is currently considered mainly responsible for the pathogenic effects [2–7, 17], could have critical implications for the pathogenesis of pseudomembranous colitis and intestinal functional alterations induced by this pathogen.
Therefore, we investigated EGC susceptibility to the cytopathic and cytotoxic effects of TcdB at the cellular and molecular levels.
This study showed for the first time that EGCs are highly susceptible to TcdB and that the main effects of TcdB are cytopathic effects that are closely correlated with Rho-GTPase glucosylation, cell-cycle arrest in the G2/M phase, apoptosis induction, increased susceptibility to apoptosis induction by proinflammatory cytokines and persistently impaired cell functions in survivor EGCs.
TcdB induced dose- and time-dependent early Rac1 glucosylation in EGCs, and once obtained, these glucosylation levels remained unchanged. However, Rac1 expression levels were significantly increased at 48 h, probably since its glucosylation affects its proteasomal degradation, as suggested by Genth et al. in another experimental model [9–11, 44, 54]. EGCs treated with TcdB also underwent cell rounding, which presented kinetics similar to those of Rac1 glucosylation. These findings are in line with Rac1 glucosylation and cytopathic effects observed in several TcdB-treated cell types [3–6, 8–12, 16].
Rho-GTPase, Rac1, RhoA and Cdc42 stimulate cell-cycle progression [13–15]. Rac1 and RhoA promote the G1/S transition by increasing the level of cyclin D; RhoA also negatively regulates the levels of the cell-cycle inhibitors p21 and p27, although the molecular pathways are not yet clear and seem to depend on cell type, stimuli and cellular status [13–15, 45, 46]. In some cell types, TcdB inactivating Rho-GTPase induces cell-cycle arrest at the G2/M phase [18, 25], but the molecular mechanisms are not well defined. Consistent with these observations, in our study, TcdB induced EGC growth inhibition, which was mainly associated with the induction of cell-cycle arrest at the G2/M phase. In fact, already at 6 h, treatment with 1 and 10 ng/ml TcdB in EGCs induced a 2- and 3-fold, respectively, accumulation of cells in G2/M accompanied by a decrease in cells in the S phase. The percentage of cells in G2/M after treatment with TcdB at 1 and 10 ng/ml at 24 h did not change significantly with respect to that at 6 h, while at 48 h, it decreased by approximately 1.1- and 1.5-fold with respect to that at 6 h with a concomitant proportional increase in the percentage of cells in G0/G1. This decrease in cells in G2/M seems to be correlated with increased apoptosis, as was also reported by Nottrott et al. [27]. Interestingly, 0.1 ng/ml TcdB caused lower apoptosis at 24 h and EGC arrest in the G0/G1 phase.
Eukaryotic cell-cycle progression is controlled by the action of CDKs and their activating subunits, cyclins, which form heterodimeric complexes that phosphorylate downstream targets to drive the cell cycle [47–50]. CDK1, also known as Cdc2, and cyclin B are essential for the entry of cells into mitosis [47–50]. Cdc2 is inactive as a monomer and must bind with cyclin B during the G2/M transition. The inhibition of Cdc2 in mammalian cells has been shown to result in cell-cycle arrest at the G2 phase [47–50]. This study demonstrated that in EGCs, TcdB led to the dose-dependent inhibition of cyclin B1 expression, which may be one of the reasons for G2/M arrest in EGCs. In fact, the downregulation of this positive regulator of cell-cycle progression impairs cyclin B/Cdc2 complex activity and hinders the G2/M transition [47–50]. Cyclin B/Cdc2 complex activity is also related to Cdc2 kinase phosphorylation status [47–50]. The hyperphosphorylation of Cdc2 at Thr14/Tyr15 and the dephosphorylation of Cdc2 at Thr161 are responsible for cell-cycle arrest at the G2 phase [47–50]. Our results showed that treating EGCs with TcdB downregulates the expression of both Cdc2 phosphorylated at Tyr15 and of Cdc2 phosphorylated at Thr161, suggesting the inactivation of Cdc2 kinase. The function of the cyclin/CDK complex is negatively regulated by cell-cycle inhibitors, such as p21 and p27 proteins [47–50]; p27 also has a critical role in the control of cell proliferation. In fact, a p27 deficiency results in an increased mitotic index; p27 decreases Cdc2 protein levels and binds to the cyclin/CDK complex, inhibiting its kinase activity [47–50]. Our demonstration that TcdB markedly enhanced p27 protein levels in EGCs suggests its involvement in the G2/M phase arrest. Overall, the TcdB-mediated G2/M phase arrest in EGCs was linked to the inactivation/inhibition of the cyclin B/Cdc2 complex through the downregulation of cyclin B1 and Cdc2 phosphorylated at Tyr15 and Thr161 and the upregulation of p27.
Rho-GTPase glucosylation and cell-cycle arrest are associated with apoptosis [13–15, 25, 45, 46, 56], and this occurred in our model. In fact, TcdB induces apoptosis in EGCs in a dose- and time-dependent manner, with approximately 10.2, 44.2 and 46.9% apoptosis at 24 h after treatment with TcdB at 0.1, 1 and 10 ng/ml, respectively. The apoptosis of EGCs induced by 1 and 10 ng/ml TcdB is characterized by the following: (1) the absence of alterations in the expression/activation of pro-apoptotic (Bax and Bak) and anti-apoptotic (Bcl-XL; Bcl-2) Bcl-2 family members; (2) the absence of caspase-9 activation; (3) an early and strong caspase-3 and PARP activation at 6 h, which strongly increases up to 24 h; and (4) a later caspase-7 activation that occur at 24 h subsequently to caspase-3 activation, suggesting that the caspase-7 participation is only for the amplification of the apoptotic signal, as found in other experimental models [51, 52]. The characteristics of EGC apoptosis induced by 0.1 ng/ml TcdB are similar to those of EGC apoptosis induced by 1 and 10 ng/ml TcdB, with the only difference being that the activation of caspase-3, caspase-7 and PARP occurs later, only after 24 h. In contrast with the other concentrations, 0.1 ng/ml TcdB induces the activation of caspase-9 at 24 h, suggesting that there is not a linear correlation between TcdB concentration and the pattern of apoptosis molecular mechanisms. Our results also indicate that all the TcdB concentrations used cause upregulated ROCK1 expression, a direct target both of Rho-GTPases and caspase-3; similar to what has been described in other apoptotic models [51–53], ROCK1 could contribute to multiple aspects of the apoptotic processes in our model.
Caspases are essential for TcdB-induced EGC apoptosis because of the following: (1) BAF, a general caspase inhibitor, abolished apoptosis and strongly reduced the cleavage of caspase-3 into the 17 kDa fully active fragment and the cleavage of caspase-7 into the 20 kDa active fragment; and (2) Z-DEVD-FMK, an inhibitor of caspase-3 and caspase-7, partially inhibited apoptosis, the cleavage of caspase-3 into the 17 and 19 kDa active fragments and the cleavage of caspase-7 into the 20 kDa active fragment. However, the molecular mechanisms of PARP cleavage and its role in TcdB-induced apoptosis remain to be defined. In fact, its cleavage does not seem to be mediated by caspases because it was not prevented by BAF and was only partially inhibited by Z-DEVD-FMK.
These results regarding TcdB-induced EGC apoptosis mechanisms seem to differ from those reported for other cell types [4–6, 20, 22–24, 26], in which C. difficile toxins caused alterations in the expression/activation ratios between pro-apoptotic and anti-apoptotic Bcl-2 members involving Bak, which finally caused cytochrome c release and caspase-9 activation, leading to effector caspase activation. In EGCs, the lack of such changes, together with the early activation of caspase-3 and PARP and the late activation of caspase-7, could reflect cell-specific responses to TcdB. Therefore, although these data indicate that caspase-3 and PARP, in line with previous reports [4–6, 18, 20, 24–28], essentially executed the TcdB-induced EGC apoptosis, some relevant differences were found, e.g., there were no changes in Bak expression, no caspase-9 activation, early caspase-3 and PARP activation, later caspase-7 activation, and interestingly, ROCK1 overexpression. ROCK is recognized as a major regulator of the morphological events that occur during the execution phase of apoptosis, including cytoskeletal-mediated cell contraction, dynamic membrane blebbing, organelle fragmentation, nuclear disintegration and apoptotic cell fragmentation into apoptotic bodies [13–15, 46, 51–53, 62]. ROCK1 regulates these events by stimulating actomyosin contractility via increasing myosin light chain (MLC) phosphorylation, with either a direct effect on MLC or an indirect effect inactivating MLC phosphatase [13–15, 46, 51–53, 62]. ROCK1 is also involved in the intracellular signalling mediating the initiating stages of apoptosis through the following [13–15, 53, 62]: (1) the loss of cell adhesion via actin cytoskeleton rearrangement; (2) the modulation of Bcl-2 family member gene expression in favour of apoptosis via phosphatidylinositide 3-kinase (PI3K) or c-Jun N-terminal kinase (JNK); (3) the regulation of apoptotic cascades modulating the activation of multiple caspases into their active forms; and (4) the inactivation of the pro-survival PI3K-Akt pathway via phosphatase and tensin homologue (PTEN) stimulation. However, in our model, ROCK1 overexpression began at 24 h, concomitant with the detection of DNA fragmentation and higher levels of caspase-3 and caspase-7 activation. Furthermore, there was no increase in the expression of pro-apoptotic Bcl-2 family members. These data suggest that ROCK1 is not involved in triggering apoptosis but could be a driver of the morphological events characterizing the execution phase of apoptosis by stimulating actomyosin contractility through increasing MLC phosphorylation and maintaining/inducing later caspase activation when apoptosis was reduced. Additionally, p27 overexpression leads to apoptosis in several cell lines from different species and tissues of origin, providing direct evidence that p27 might also act to regulate cell growth through its ability to induce apoptosis [45, 46, 63–67]. Such apoptosis is mainly associated with concomitant PARP cleavage and cyclin B1 degradation [45, 46, 63–67]. Since, in our model, we found PARP cleavage and cyclin B1 degradation concomitant with p27 overexpression, the early, strong overexpression of p27 in EGCs suggests its involvement in TcdB-induced apoptosis through the regulation of the expression of these molecules.
Knowing that primary EGCs are resistant to apoptosis induced by proinflammatory cytokines [30–34, 43, 60, 61], because C. difficile infection causes a strong inflammatory environment dominated by proinflammatory cytokines [2–6, 29, 58–60], cells localized in the intestinal wall, including EGCs, during C. difficile infection are subjected to strong stimulation by inflammatory cytokines, such as IL-1β, TNF-α and IFN-γ. In fact, before reaching the deeper layers of the intestinal mucosa in vivo, C. difficile toxins breach the intestinal epithelial barrier and act on enterocytes, immune cells and enteric neurons, inducing a strong proinflammatory response and disrupting the colonic epithelial cell barrier [2–6, 29, 58–60]. Therefore, EGCs in vivo are likely to encounter cytokines secreted by enterocytes/immune cells/neurons during C. difficile infection that could alter EGC functionality before coming in contact with TcdB [2–7, 29, 58–60]. This prompted us to investigate whether inflammatory cytokines could alter the susceptibility of EGCs to TcdB. Our results demonstrated that independently of the time in which EGCs encountered TNF-α plus IFN-γ with respect to the TcdB treatment (i.e., before, after or with the TcdB treatment), the encounter enhanced the susceptibility of EGCs to TcdB-induced apoptosis via the apoptotic pathway mediated by caspase-3, caspase-7 and PARP. Currently, we do not know the mechanism for this increased susceptibility, but these data are very suggestive for the possible role of proinflammatory cytokines in increasing the pathological effects of C. difficile infections.
Since both C. difficile toxins cause proinflammatory activity in several cell types [4–6, 29], if EGCs express proinflammatory cytokines in response to TcdB, then they alone could be responsible for the apoptotic effects of TcdB, which would increase when EGCs are further treated with TNF-α plus IFN-γ. Our results showed that control EGCs and TcdB-treated EGCs did not secrete levels of TNF-α, IFN-γ, or IL-1β detectable by the ELISA kits used, which have a sensitivity of 46.88 pg/ml for TNF-α and 18.75 pg/ml for IFN-γ and IL-1β. Therefore, even if the TcdB induces a cytokine response in EGCs undetectable by the ELISA kits used, the levels of cytokines produced are not responsible for the induction of apoptosis because: (1) the increased susceptibility of EGCs to TcdB-induced apoptosis was induced by 50 ng/ml TNF-α plus 50 ng/ml IFN-γ; and (2) stimulation of EGCs with 10 ng/ml TNF-α plus 10 ng/ml IFN-γ, a concentration much higher than could be secreted by EGCs did not increase TcdB-induced apoptosis (data not shown).
This study also showed that EGCs can survive the cytotoxic effects of TcdB, and although they do not recover completely, as demonstrated by strong Rac1 glucosylation, cell-cycle arrest and a low percentage of hypodiploid DNA, they strongly enhanced GDNF secretion at 48 h, which increased up to 13 days. At this time, the secretion of GDNF was increased by approximately sixfold in EGCs treated with 10 ng/ml TcdB. The increase in GDNF production by EGCs suggests a self-rescuing mechanism because of the following: (1) GDNF plays a protective role against the apoptosis of neuronal cells and EGCs [30–34, 60, 61, 68–72]; (2) EGCs can transduce GDNF signalling because they express functional receptors for GDNF [30–34, 61]; and (3) cells surviving after TcdB treatment maintain intercellular connections that could be due to GDNF action [30–34, 68–72]. This very important phenomenon will be addressed in our future studies. The enteric neuron abnormalities subsequent to EGC damage or loss [71] and the demonstration that a significant percentage of patients recovering from C. difficile infection subsequently experienced moderate-to-severe irritable bowel syndrome [73–75] could be partially explained by our in vitro results, which suggest that the persistence of altered functions in EGCs surviving exposure to TcdB could be involved in the functional gastrointestinal disorders in patients recovering from C. difficile infection [1–3, 6, 35, 36, 73–75].
In conclusion, this study shows for the first time in vitro that EGCs are affected by secreted TcdB, which induces cell death, functional impairment, cell-cycle arrest and that inflammatory cytokines increased EGC susceptibility to TcdB. Furthermore, EGCs that survived to TcdB persistently secreted GDNF and maintained functional changes even after long time from contact with TcdB.
Electronic supplementary material
Below is the link to the electronic supplementary material.
Supplementary material 1 (TIFF 15168 kb)
Acknowledgements
The authors thank Springer Nature Author Services for editing of English language. We are greatly indebted to Alfa Wasserman, Sofar, and Almirall companies for their generous unrestricted support. This work was supported by a Project from the Department of Experimental Medicine for Basic Research (bando 2014) awarded to Doctor Katia Fettucciari, a Grant from Fondazione Cassa di Risparmio di Perugia, Italy (bando 2015-2015.0327.021 Ricerca Scientifica e Tecnologica) to Professor Lanfranco Corazzi, and a grant from “AIGO fa RICERCA” awarded to Professor Gabrio Bassotti by the Italian Society of Hospital Gastroenterologists and Endoscopists (AIGO).
Abbreviations
- TcdA
Toxin A of Clostridium difficile
- TcdB
Toxin B of Clostridium difficile
- EGCs
Enteric glial cells
- ENS
Enteric nervous system
- GDNF
Glial cell-derived neurotrophic factor
- NGF
Nerve growth factor
- TNF-α
Tumour necrosis factor-alpha
- IFN-γ
Interferon-gamma
- DMEM
Dulbecco’s modified Eagle’s medium
- FBS
Foetal bovine serum
- PI
Propidium iodide
- IL-1β
Interleukin-1beta
- U
Densitometric units
- CDKs
Cyclin-dependent kinases
- Cdc2
Cell division cycle 2
- GFAP
Glial fibrillary acidic protein
- PARP
Poly (ADP-ribose) polymerase
- BAF
Boc-Asp(OMe)-fluoromethylketone
- Z-DEVD-FMK
Z-Asp-Glu-Val-Asp-fluoromethylketone
- ROCK1
Rho-associated coiled-coil containing kinase 1
- PAK1
p21-activated kinase 1
- PI3K
Phosphatidylinositide 3-kinase
- JNK
c-Jun N-terminal kinase
Compliance with ethical standards
Conflict of interest
The authors declare no financial or commercial conflicts of interest.
References
- 1.Cloud J, Kelly CP. Update on Clostridium difficile associated disease. Curr Opin Gastroenterol. 2007;23:4–9. doi: 10.1097/MOG.0b013e32801184ac. [DOI] [PubMed] [Google Scholar]
- 2.Pothoulakis C, Lamont JT. Microbes and microbial toxins: paradigms for microbial-mucosal interactions II. The integrated response of the intestine to Clostridium difficile toxins. Am J Physiol Gastrointest Liver Physiol. 2001;280:G178–G183. doi: 10.1152/ajpgi.2001.280.2.G178. [DOI] [PubMed] [Google Scholar]
- 3.Lyerly DM, Krivan HC, Wilkins TD. Clostridium difficile: its disease and toxins. Clin Microbiol Rev. 1988;1:1–18. doi: 10.1128/CMR.1.1.1. [DOI] [PMC free article] [PubMed] [Google Scholar]
- 4.Sun X, Savidge T, Feng H. The enterotoxicity of Clostridium difficile toxins. Toxins (Basel) 2010;2:1848–1880. doi: 10.3390/toxins2071848. [DOI] [PMC free article] [PubMed] [Google Scholar]
- 5.Pruitt RN, Lacy DB. Toward a structural understanding of Clostridium difficile toxins A and B. Front Cell Infect Microbiol. 2012;2:1–28. doi: 10.3389/fcimb.2012.00028. [DOI] [PMC free article] [PubMed] [Google Scholar]
- 6.Voth DE, Ballard JD. Clostridium difficile toxins: mechanism of action and role in disease. Clin Microbiol Rev. 2005;18:247–263. doi: 10.1128/CMR.18.2.247-263.2005. [DOI] [PMC free article] [PubMed] [Google Scholar]
- 7.Lyras D, O’Connor JR, Howarth PM, Sambol SP, Carter GP, Phumoonna T, Poon R, Adams V, Vedantam G, Johnson S, Gerding DN, Rood JI. Toxin B is essential for virulence of Clostridium difficile . Nature. 2009;458:1176–1179. doi: 10.1038/nature07822. [DOI] [PMC free article] [PubMed] [Google Scholar]
- 8.Aktories K, Just I. Clostridial Rho-inhibiting protein toxins. Curr Top Microbiol Immunol. 2005;291:113–145. doi: 10.1007/3-540-27511-8_7. [DOI] [PubMed] [Google Scholar]
- 9.Huelsenbeck J, Dreger S, Gerhard R, Barth H, Just I, Genth H. Difference in the cytotoxic effects of toxin B from Clostridium difficile strain VPI 10463 and Toxin B from variant Clostridium difficile strain 1470. Infect Immun. 2007;75:801–809. doi: 10.1128/IAI.01705-06. [DOI] [PMC free article] [PubMed] [Google Scholar]
- 10.Genth H, Huelsenbeck J, Hartmann B, Hofmann F, Just I, Gerhard R. Cellular stability of Rho-GTPases glucosylated by Clostridium difficile toxin B. FEBS Lett. 2006;580:3565–3569. doi: 10.1016/j.febslet.2006.04.100. [DOI] [PubMed] [Google Scholar]
- 11.Halabi-Cabezon I, Huelsenbeck J, May M, Ladwein M, Rottner K, Just I, Genth H. Prevention of the cytopathic effect induced by Clostridium difficile toxin B by active Rac1. FEBS Lett. 2008;582:3751–3756. doi: 10.1016/j.febslet.2008.10.003. [DOI] [PubMed] [Google Scholar]
- 12.Popoff MR, Geny B. Rho/Ras-GTPase-dependent and -independent activity of clostridial glucosylating toxins. J Med Microbiol. 2011;60:1057–1069. doi: 10.1099/jmm.0.029314-0. [DOI] [PubMed] [Google Scholar]
- 13.Bishop AL, Hall A. Rho GTPases and their effector proteins. Biochem J. 2000;348:241–255. doi: 10.1042/bj3480241. [DOI] [PMC free article] [PubMed] [Google Scholar]
- 14.Etienne-Manneville S, Hall A. Rho GTPases in cell biology. Nature. 2002;420:629–635. doi: 10.1038/nature01148. [DOI] [PubMed] [Google Scholar]
- 15.Karlsson R, Pedersen ED, Wang Z, Brakebusch C. Rho GTPase function in tumorigenesis. Biochim Biophys Acta. 2009;1796:91–98. doi: 10.1016/j.bbcan.2009.03.003. [DOI] [PubMed] [Google Scholar]
- 16.Fiorentini C, Arancia G, Paradisi S, Donelli G, Giuliano M, Piemonte F, Mastrantonio P. Effects of Clostridium difficile Toxins A and B on cytoskeleton organization in HEp-2 cells: a comparative morphological study. Toxicon. 1989;27:1209–1218. doi: 10.1016/0041-0101(89)90029-9. [DOI] [PubMed] [Google Scholar]
- 17.Riegler M, Sedivy R, Pothoulakis C, Hamilton G, Zacherl J, Bischof G, Cosentini E, Feil W, Schiessel R, LaMont JT, Wenzi E. Clostridium difficile toxin B is more potent than toxin A in damaging human colonic epithelium in vitro. J Clin Invest. 1995;95:2004–2011. doi: 10.1172/JCI117885. [DOI] [PMC free article] [PubMed] [Google Scholar]
- 18.Gerhard R, Nottrott S, Schoentaube J, Tatge H, Olling A, Just I. Glucosylation of Rho GTPases by Clostridium difficile toxin A triggers apoptosis in intestinal epithelial cells. J Med Microbiol. 2008;57:765–770. doi: 10.1099/jmm.0.47769-0. [DOI] [PubMed] [Google Scholar]
- 19.Fiorentini C, Fabbri A, Falzano L, Fattorossi A, Matarrese P, Rivabene R, Donelli G. Clostridium difficile toxin B induces apoptosis in intestinal cultured cells. Infect Immun. 1998;66:2660–2665. doi: 10.1128/iai.66.6.2660-2665.1998. [DOI] [PMC free article] [PubMed] [Google Scholar]
- 20.Brito GA, Fujji J, Carneiro-Filho BA, Lima AA, Obrig T, Guerrant RL. Mechanism of Clostridium difficile toxin A-induced apoptosis in T84 cells. J Infect Dis. 2002;186:1438–1447. doi: 10.1086/344729. [DOI] [PubMed] [Google Scholar]
- 21.Mahida YR, Galvin A, Makh S, Hyde S, Sanfilippo L, Borriello SP, Sewell HF. Effect of Clostridium difficile toxin A on human colonic lamina propria cells: early loss of macrophages followed by T-cell apoptosis. Infect Immun. 1998;66:5462–5469. doi: 10.1128/iai.66.11.5462-5469.1998. [DOI] [PMC free article] [PubMed] [Google Scholar]
- 22.He D, Hagen SJ, Pothoulakis C, Chen M, Medina ND, Warny M, LaMont JT. Clostridium difficile toxin A causes early damage to mitochondria in cultured cells. Gastroenterology. 2000;119:139–150. doi: 10.1053/gast.2000.8526. [DOI] [PubMed] [Google Scholar]
- 23.Linseman D, Laessig T, Meintzer MK, McClure M, Barth H, Aktories K, Heidenreich KA. An essential role for Rac/Cdc42 GTPases in cerebellar granule neuron survival. J Biol Chem. 2001;276:39123–39131. doi: 10.1074/jbc.M103959200. [DOI] [PubMed] [Google Scholar]
- 24.Hippenstiel S, Schmeck B, N’Guessan PD, Seybold J, Krull M, Preissner K, Eichel-Streiber CV, Suttorp N. Rho protein inactivation induced apoptosis of cultured human endothelial cells. Am J Physiol Lung Cell Mol Physiol. 2002;283:L830–L838. doi: 10.1152/ajplung.00467.2001. [DOI] [PubMed] [Google Scholar]
- 25.Kim H, Kokkotou E, Na X, Rhee SH, Moyer MP, Pothoulakis C, Lamont JT. Clostridium difficile toxin A-induced colonocyte apoptosis involves p53-dependent p21(WAF1/CIP1) induction via p38 mitogen-activated protein kinase. Gastroenterology. 2005;129:1875–1888. doi: 10.1053/j.gastro.2005.09.011. [DOI] [PubMed] [Google Scholar]
- 26.Matarrese P, Falzano L, Fabbri A, Gambardella L, Frank C, Geny B, Popoff MR, Malorni W, Fiorentini C. Clostridium difficile toxin B causes apoptosis in epithelial cells by thrilling mitochondria. Involvement of ATP-sensitive mitochondrial potassium channels. J Biol Chem. 2007;282:9029–9041. doi: 10.1074/jbc.M607614200. [DOI] [PubMed] [Google Scholar]
- 27.Nottrott S, Schoentaube J, Genth H, Just I, Gerhard R. Clostridium difficile toxin A-induced apoptosis is p53-independent but depends on glucosylation of Rho GTPases. Apoptosis. 2007;12:1443–1453. doi: 10.1007/s10495-007-0074-8. [DOI] [PubMed] [Google Scholar]
- 28.Qa’Dan M, Ramsey M, Daniel J, Spyres LM, Safiejko-Mroczka B, Ortiz-Leduc W, Ballard JD. Clostridium difficile toxin B activates dual caspase-dependent and caspase-independent apoptosis in intoxicated cells. Cell Microbiol. 2002;4:425–434. doi: 10.1046/j.1462-5822.2002.00201.x. [DOI] [PubMed] [Google Scholar]
- 29.Savidge TC, Pan WH, Newman P, O’Brien M, Anton PM, Pothoulakis C. Clostridium difficile toxin B is an inflammatory enterotoxin in human intestine. Gastroenterology. 2003;125:413–420. doi: 10.1016/S0016-5085(03)00902-8. [DOI] [PubMed] [Google Scholar]
- 30.Yu YB, Li YQ. Enteric glial cells and their role in the intestinal epithelial barrier. World J Gastroenterol. 2014;20:11273–11280. doi: 10.3748/wjg.v20.i32.11273. [DOI] [PMC free article] [PubMed] [Google Scholar]
- 31.Neunlist M, Rolli-Derkinderen M, Latorre R, Van Landeghem L, Coron E, Derkinderen P, De Giorgio R. Enteric glial cells: recent developments and future directions. Gastroenterology. 2014;147:1230–1237. doi: 10.1053/j.gastro.2014.09.040. [DOI] [PubMed] [Google Scholar]
- 32.Gulbransen BD. Colloquium series on neuroglia in biology and medicine: from physiology to disease. San Rafael: Morgan & Claypool Publishers; 2014. Enteric glia; pp. 1–70. [Google Scholar]
- 33.Gulbransen BD, Sharkey KA. Novel functional roles for enteric glia in the gastrointestinal tract. Nat Rev Gastroenterol Hepatol. 2012;9:625–632. doi: 10.1038/nrgastro.2012.138. [DOI] [PubMed] [Google Scholar]
- 34.Cirillo C, Sarnelli G, Esposito G, Turco F, Steardo L, Cuomo R. S100B protein in the gut: the evidence for enteroglial-sustained intestinal inflammation. World J Gastroenterol. 2011;17:1261–1266. doi: 10.3748/wjg.v17.i10.1261. [DOI] [PMC free article] [PubMed] [Google Scholar]
- 35.Bassotti G, Villanacci V, Maurer CA, Fisogni S, Di Fabio F, Cadei M, Morelli A, Panagiotis T, Cathomas G, Salerni B. The role of glial cells and apoptosis of enteric neurones in the neuropathology of intractable slow transit constipation. Gut. 2006;55:41–46. doi: 10.1136/gut.2005.073197. [DOI] [PMC free article] [PubMed] [Google Scholar]
- 36.Bassotti G, Villanacci V. Can “functional” constipation be considered as a form of enteric neuro-gliopathy? Glia. 2011;59:345–350. doi: 10.1002/glia.21115. [DOI] [PubMed] [Google Scholar]
- 37.Rühl A, Trotter J, Stremmel W. Isolation of enteric glia and establishment of transformed enteroglial cell lines from the myenteric plexus of adult rat. Neurogastroenterol Motil. 2001;13:95–106. doi: 10.1046/j.1365-2982.2001.00246.x. [DOI] [PubMed] [Google Scholar]
- 38.Soret R, Coquenlorge S, Cossais F, Meurette G, Rolli-Derkinderen M, Neunlist M. Characterization of human, mouse, and rat cultures of enteric glial cells and their effect on intestinal epithelial cells. Neurogastroenterol Motil. 2013;25:e755–e764. doi: 10.1111/nmo.12200. [DOI] [PubMed] [Google Scholar]
- 39.Fettucciari K, Rosati E, Scaringi L, Cornacchione P, Migliorati G, Sabatini R, Fetriconi I, Rossi R, Marconi P. Group B Streptococcus induces apoptosis in macrophages. J Immunol. 2000;165:3923–3933. doi: 10.4049/jimmunol.165.7.3923. [DOI] [PubMed] [Google Scholar]
- 40.Fettucciari K, Fetriconi I, Mannucci R, Nicoletti I, Bartoli A, Coaccioli S, Marconi P. Group B Streptococcus induces macrophage apoptosis by calpain activation. J Immunol. 2006;176:7542–7556. doi: 10.4049/jimmunol.176.12.7542. [DOI] [PubMed] [Google Scholar]
- 41.Nicoletti I, Migliorati G, Pagliacci MC, Grignani F, Riccardi C. J Immunol Methods. 1991;139:271–279. doi: 10.1016/0022-1759(91)90198-O. [DOI] [PubMed] [Google Scholar]
- 42.Gerashchenko BI, Azzam EI, Howell RW. Cytometry A. 2004;61:134–141. doi: 10.1002/cyto.a.20065. [DOI] [PubMed] [Google Scholar]
- 43.von Boyen GBT. Proinflammatory cytokines increase glial fibrillary acidic protein expression in enteric glia. Gut. 2004;53:222–228. doi: 10.1136/gut.2003.012625. [DOI] [PMC free article] [PubMed] [Google Scholar]
- 44.May M, Wang T, Müller M, Genth H. Difference in F-actin depolymerization induced by toxin B from the Clostridium difficile strain VPI 10463 and toxin B from the variant Clostridium difficile serotype F strain 1470. Toxins (Basel) 2013;5:106–119. doi: 10.3390/toxins5010106. [DOI] [PMC free article] [PubMed] [Google Scholar]
- 45.Vermeulen K, Berneman ZN, Van Bockstaele DR. Cell-cycle and apoptosis. Cell Prolif. 2003;36:165–175. doi: 10.1046/j.1365-2184.2003.00267.x. [DOI] [PMC free article] [PubMed] [Google Scholar]
- 46.Jacotot E, Ferri KF, Kroemer G. Apoptosis and cell cycle: distinct checkpoints with overlapping upstream control. Pathol Biol (Paris) 2000;48:271–279. [PubMed] [Google Scholar]
- 47.Su CC, Lin JG, Chen GW, Lin WC, Chung JG. Down-regulation of Cdc25c, CDK1 and cyclin B1 and up-regulation of Wee1 by curcumin promotes human colon cancer colo 205 cell entry into G2/M-phase of cell cycle. Cancer Genom Proteom. 2006;3:55–62. [PubMed] [Google Scholar]
- 48.Zhang XH, Zou ZQ, Xu CW, Shen YZ, Li D. Myricetin induces G2/M phase arrest in HepG2 cells by inhibiting the activity of the cyclin B/Cdc2 complex. Mol Med Rep. 2011;4:273–277. doi: 10.3892/mmr.2011.417. [DOI] [PubMed] [Google Scholar]
- 49.Ando Y, Yasuda S, Oceguera-Yanez F, Narumiya S. Inactivation of Rho GTPases with Clostridium difficile toxin B impairs centrosomal activation of Aurora-A in G2/M transition of HeLa cells. Mol Biol Cell. 2007;18:3752–3763. doi: 10.1091/mbc.E07-03-0281. [DOI] [PMC free article] [PubMed] [Google Scholar]
- 50.Malumbres M, Barbacid M. Mammalian cyclin-dependent kinases. Trends Biochem Sci. 2005;30:630–641. doi: 10.1016/j.tibs.2005.09.005. [DOI] [PubMed] [Google Scholar]
- 51.Wyllie AH. “Where, O death, is thy sting?” A brief review of apoptosis biology. Mol Neurobiol. 2010;42:4–9. doi: 10.1007/s12035-010-8125-5. [DOI] [PMC free article] [PubMed] [Google Scholar]
- 52.Kaufmann SH, Hengartner MO. Programmed cell death: alive and well in the new millennium. Trends Cell Biol. 2001;11:526–534. doi: 10.1016/S0962-8924(01)02173-0. [DOI] [PubMed] [Google Scholar]
- 53.Street CA, Bryan BA. Rho kinase proteins—pleiotropic modulators of cell survival and apoptosis. Anticancer Res. 2011;31:3645–3657. [PMC free article] [PubMed] [Google Scholar]
- 54.Schoentaube J, Olling A, Tatge H, Just I, Gerhard R. Serine-71 phosphorylation of Rac1/Cdc42 diminishes the pathogenic effect of Clostridium difficile toxin A. Cell Microbiol. 2009;11:1816–1826. doi: 10.1111/j.1462-5822.2009.01373.x. [DOI] [PubMed] [Google Scholar]
- 55.Gao Y, Dickerson JB, Guo F, Zheng J, Zheng Y. Rational design and characterization of a Rac GTPase-specific small molecule inhibitor. Proc Natl Acad Sci USA. 2004;101:7618–7623. doi: 10.1073/pnas.0307512101. [DOI] [PMC free article] [PubMed] [Google Scholar]
- 56.Yoshida T, Zhang Y, Rivera Rosado LA, Chen J, Khan T, Moon SY, Zhang B. Blockade of Rac1 activity induces G1 cell cycle arrest or apoptosis in breast cancer cells through downregulation of cyclin D1, survivin, and X-linked inhibitor of apoptosis protein. Mol Cancer Ther. 2010;9:1657–1668. doi: 10.1158/1535-7163.MCT-09-0906. [DOI] [PubMed] [Google Scholar]
- 57.Stankiewicz TR, Ramaswami SA, Bouchard RJ, Aktories K, Linseman DA. Neuronal apoptosis induced by selective inhibition of Rac GTPase versus global suppression of Rho family GTPases is mediated by alterations in distinct mitogen-activated protein kinase signaling cascades. J Biol Chem. 2015;290:9363–9376. doi: 10.1074/jbc.M114.575217. [DOI] [PMC free article] [PubMed] [Google Scholar]
- 58.Steele J, Chen K, Sun X, Zhang Y, Wang H, Tzipori S, Feng H. Systemic dissemination of Clostridium difficile toxins A and B is associated with severe, fatal disease in animal models. J Infect Dis. 2012;205:384–391. doi: 10.1093/infdis/jir748. [DOI] [PMC free article] [PubMed] [Google Scholar]
- 59.Czepiel J, Biesiada G, Brzozowski T, Ptak-Belowska A, Perucki W, Birczynska M, Jurczyszyn A, Strzalka M, Targosz A, Garlicki A. The role of local and systemic cytokines in patients infected with Clostridium difficile . J Physiol Pharmacol. 2014;65:695–703. [PubMed] [Google Scholar]
- 60.Steinkamp M, Schulte N, Spaniol U, Pflüger C, Hartmann C, Kirsch J, von Boyen GB. Brain derived neurotrophic factor inhibits apoptosis in enteric glia during gut inflammation. Med Sci Monit. 2012;18:BR117–BR122. doi: 10.12659/MSM.882612. [DOI] [PMC free article] [PubMed] [Google Scholar]
- 61.Steinkamp M, Gundel H, Schulte N, Spaniol U, Pflueger C, Zizer E, von Boyen GB. GDNF protects enteric glia from apoptosis: evidence for an autocrine loop. BMC Gastroenterol. 2012;12:1–6. doi: 10.1186/1471-230X-12-6. [DOI] [PMC free article] [PubMed] [Google Scholar]
- 62.Shi J, Wei L. Rho kinase in the regulation of cell death and survival. Arch Immunol Ther Exp (Warsz) 2007;55:61–75. doi: 10.1007/s00005-007-0009-7. [DOI] [PMC free article] [PubMed] [Google Scholar]
- 63.Coqueret O. New roles for p21 and p27 cell-cycle inhibitors: a function for each cell compartment? Trends Cell Biol. 2003;13:65–70. doi: 10.1016/S0962-8924(02)00043-0. [DOI] [PubMed] [Google Scholar]
- 64.Katayose Y, Kim M, Rakkar AN, Li Z, Cowan KH, Seth P. Promoting apoptosis: a novel activity associated with the cyclin-dependent kinase inhibitor p27. Cancer Res. 1997;57:5441–5445. [PubMed] [Google Scholar]
- 65.Wang X, Gorospe M, Huang Y, Holbrook NJ. p27Kip1 overexpression causes apoptotic death of mammalian cells. Oncogene. 1997;15:2991–2997. doi: 10.1038/sj.onc.1201450. [DOI] [PubMed] [Google Scholar]
- 66.Kim HJ, Ghil KC, Kim MS, Yeo SH, Chun YJ, Kim MY. Potentiation of ceramide-induced apoptosis by p27kip1 overexpression. Arch Pharm Res. 2005;28:87–92. doi: 10.1007/BF02975141. [DOI] [PubMed] [Google Scholar]
- 67.Besson A, Dowdy SF, Roberts JM. CDK inhibitors: cell cycle regulators and beyond. Dev Cell. 2008;14:159–169. doi: 10.1016/j.devcel.2008.01.013. [DOI] [PubMed] [Google Scholar]
- 68.Airaksinen MS, Saarma M. The GDNF family: signalling, biological functions and therapeutic value. Nat Rev Neurosci. 2002;3:383–394. doi: 10.1038/nrn812. [DOI] [PubMed] [Google Scholar]
- 69.Xiao W, Wang W, Chen W, Sun L, Li X, Zhang C, Yang H. GDNF is involved in the barrier-inducing effect of enteric glial cells on intestinal epithelial cells under acute ischemia reperfusion stimulation. Mol Neurobiol. 2014;50:274–289. doi: 10.1007/s12035-014-8730-9. [DOI] [PubMed] [Google Scholar]
- 70.Sariola H, Saarma M. Novel functions and signalling pathways for GDNF. J Cell Sci. 2003;116:3855–3862. doi: 10.1242/jcs.00786. [DOI] [PubMed] [Google Scholar]
- 71.De Giorgio R, Giancola F, Boschetti E, Abdo H, Lardeux B, Neunlist M. Enteric glia and neuroprotection: basic and clinical aspects. Am J Physiol Gastrointest Liver Physiol. 2012;303:G887–G893. doi: 10.1152/ajpgi.00096.2012. [DOI] [PubMed] [Google Scholar]
- 72.Ochoa-Cortes F, Turco F, Linan-Rico A, Soghomonyan S, Whitaker E, Wehner S, Cuomo R, Christofi FL. Enteric glial cells: a new frontier in neurogastroenterology and clinical target for inflammatory Bowel diseases. Inflamm Bowel Dis. 2016;22:433–449. doi: 10.1097/MIB.0000000000000667. [DOI] [PMC free article] [PubMed] [Google Scholar]
- 73.Sethi S, Garey KW, Arora V, Ghantoji S, Rowan P, Smolensky M, DuPont HL. Increased rate of irritable bowel syndrome and functional gastrointestinal disorders after Clostridium difficile infection. J Hosp Infect. 2011;77:172–173. doi: 10.1016/j.jhin.2010.09.024. [DOI] [PubMed] [Google Scholar]
- 74.Piche T, Vanbiervliet G, Pipau FG, Dainese R, Hébuterne X, Rampal P, Collins SM. Low risk of irritable bowel syndrome after Clostridium difficile infection. Can J Gastroenterol. 2007;21:727–731. doi: 10.1155/2007/262478. [DOI] [PMC free article] [PubMed] [Google Scholar]
- 75.Wadhwa A, Al Nahhas MF, Dierkhising RA, Patel R, Kashyap P, Pardi DS, Khanna S, Grover M. High risk of post-infectious irritable bowel syndrome in patients with Clostridium difficile infection. Aliment Pharmacol Ther. 2016;44:576–582. doi: 10.1111/apt.13737. [DOI] [PMC free article] [PubMed] [Google Scholar]
Associated Data
This section collects any data citations, data availability statements, or supplementary materials included in this article.
Supplementary Materials
Supplementary material 1 (TIFF 15168 kb)


