Fig. 1.
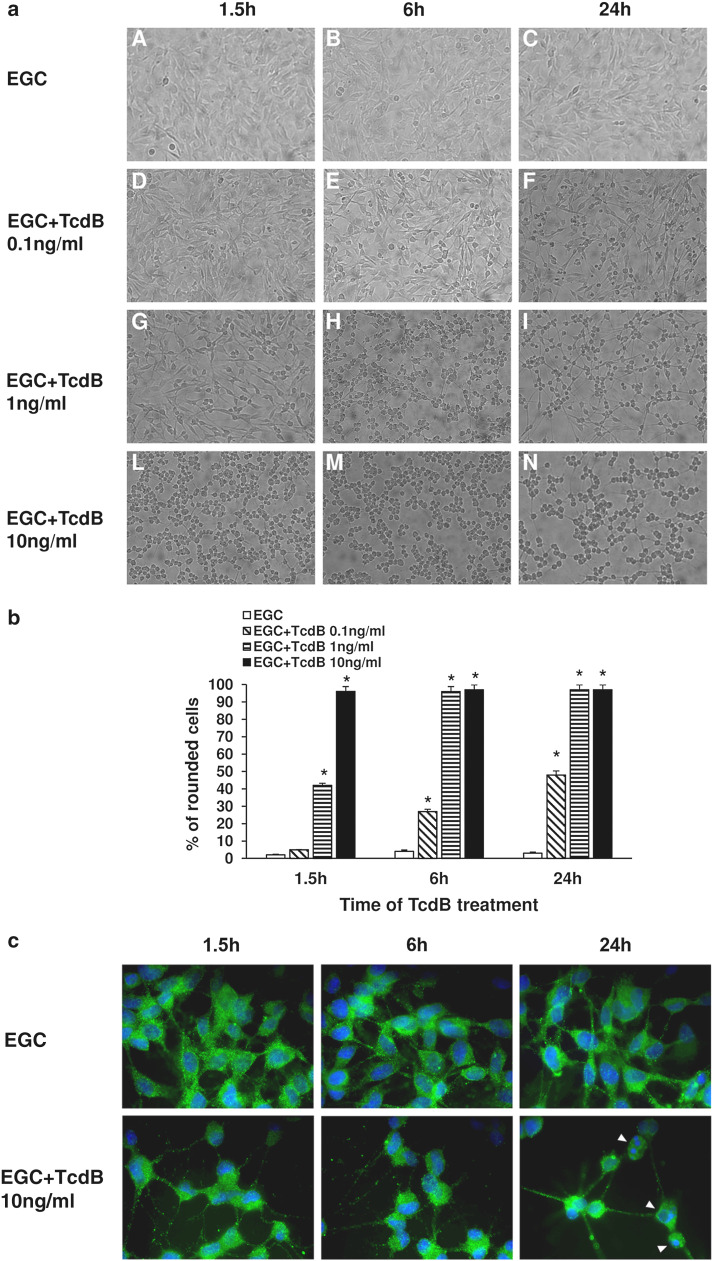
TcdB induces cytopathic effects in EGCs. a At the time indicated, control EGCs (images A–C), EGCs treated with 0.1 ng/ml TcdB (images D–F), EGCs treated with 1 ng/ml TcdB (images G–I) and EGCs treated with 10 ng/ml TcdB (images L–N), were analysed by microscopy, and images were captured. Images from one experiment, representative of three independent experiments, are shown. b Quantification of the percentage of rounded cells. At least 100 cells were counted for each experimental condition in three independent experiments. *P < 0.01 TcdB-treated EGCs versus control EGCs. c EGCs untreated or treated with 10 ng/ml TcdB for 1.5–24 h were immunolabelled with GFAP (green), using Hoechst (blue) to counterstain cell nuclei, and imaged using a fluorescence microscope equipped with a digital camera; original magnification, ×1000. Images from one experiment, representative of three independent experiments, are shown. At 24 h after TcdB treatment, several cells displayed condensed/fragmented nuclei (arrowheads)

