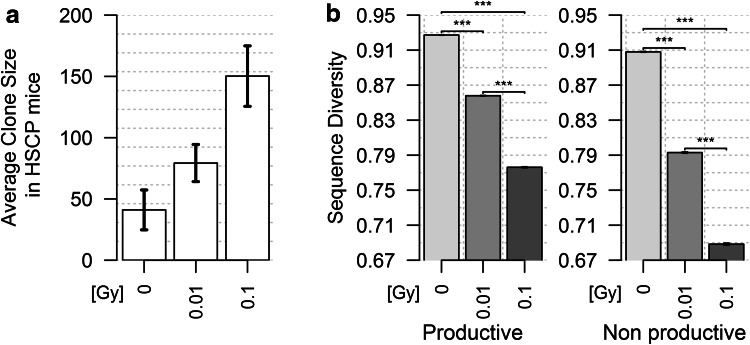
Fig. 4.
Analysis of TRB clone size and TRB gene Status Diversity in reconstituted NSG mice. a This graph represents the average (±SEM) TRB clone size in the different groups of mice. The total number of sequences obtained in each mouse was divided by the number of unique sequences in that mouse. These results were obtained from three (control and 0.01-Gy-exposed HSPC) or two (0.1-Gy-exposed HSPC) mice. b Pielou’s J Sequence Diversity index for productive (left) and non-productive (right) TRB genes in the same experimental groups. The differences between groups are significant (p < 10−7). b Frequency of productive and non-productive TRB genes in the peripheral blood of NSG mice reconstituted with control and irradiated HSCP

