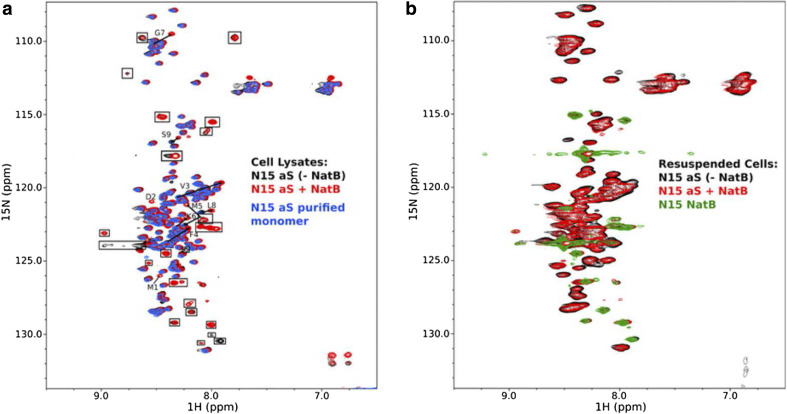
Fig. 5.
Nuclear magnetic resonance spectra of α-synuclein recorded in vitro and in vivo. a Proton–nitrogen correlation (HSQC) spectra of lysates from cells transfected with α-synuclein alone (black), α-synuclein and NatB (acetyltransferase) together (red), and purified recombinant α-synuclein (blue). Peaks present in spectra of lysates from cells transfected with NatB alone are indicated by boxes and do not originate from or report on α-synuclein. The resonances that change position upon co-transfection with NatB are indicated by arrows pointing from their position in the unmodified protein spectrum toward their position in the modified protein spectrum. Resonances for residues Met-1 and Asp-2, which are not typically observed for the unacetylated protein, are indicated. b Proton–nitrogen HSQC spectra for intact cells transfected with α-synuclein alone (black), α-synuclein and NatB together (red), and NatB alone (green)
Reprinted from Ref. [119]. Copyright 2012 American Society for Biochemistry and Molecular Biology

