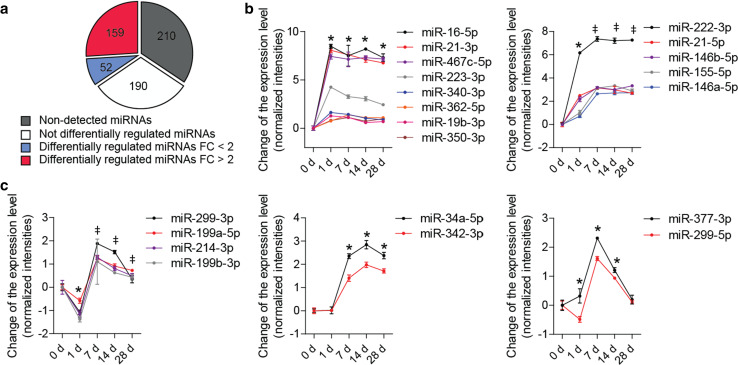
Fig. 1.
Differential expression of miRNAs during neointima formation. a–c miRNA microarray analysis was performed in carotid arteries from Apoe −/− mice before (0 day) and 1, 7, 14, and 28 days after wire-induced injury (n = 3–4 mice per group). a Number of miRNAs differentially expressed (P ≤ 0.05) or not differentially expressed, among all detectable miRNAs. FC fold change. b, c Expression patterns of 21 out of the 25 most significantly regulated miRNAs (FC ≥ 2). Error bars represent ±SEM. *P < 0.05 compared with 0 day; ‡ P < 0.05 compared with 1 day

