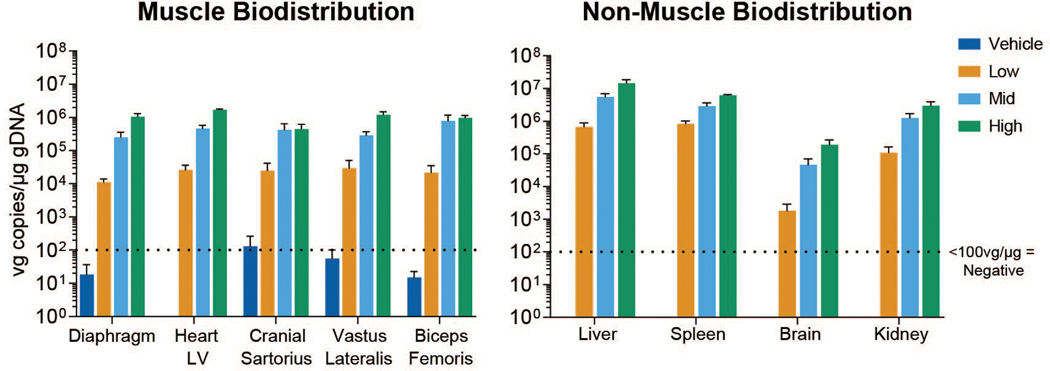
Fig. 2. Biodistribution of vector genomes (vg).
qPCR analysis of vector genome copies per microgram of genomic DNA in muscles (left) and non-muscle tissues (right) at study day 90. Means and standard deviation for all study subjects within a dose group and time point are plotted. LV = left ventricle.

