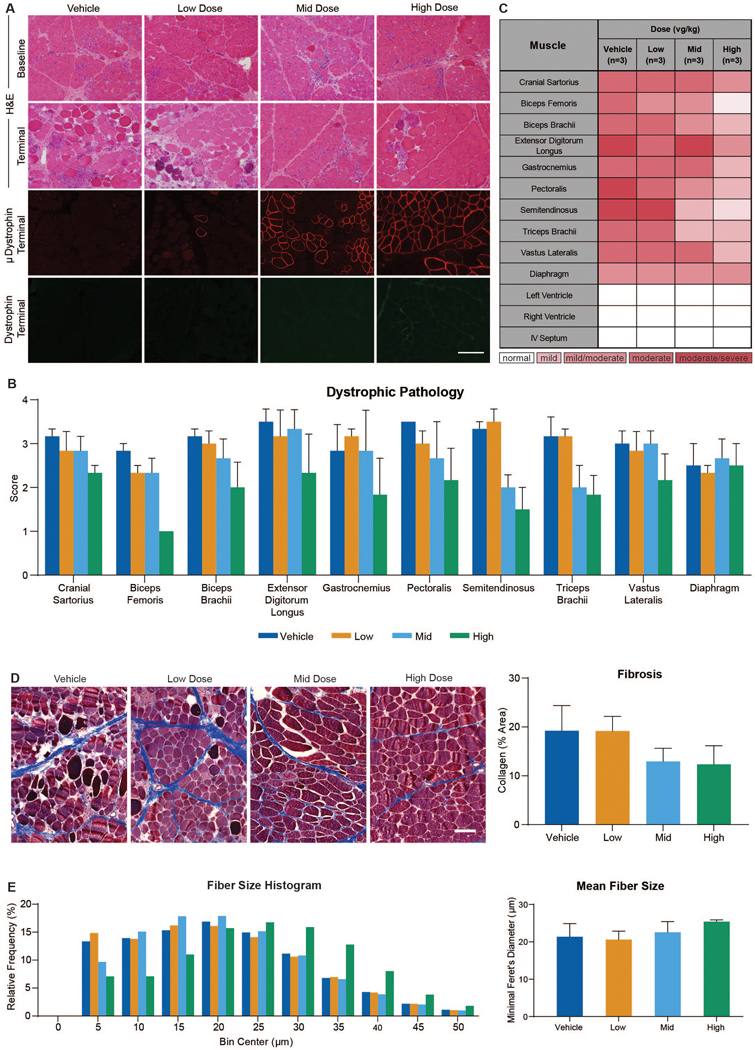
Fig. 4. AAV9-μDys5-treated dogs demonstrate reduced histopathologic lesions and fibrosis.

(A) Images of cranial sartorius muscle at baseline and Day 90 from GRMD dog with H&E staining (upper two panels). Immunofluorescence of microdystrophin (red) and dystrophin (green) at Day 90 (lower two panels). (B) Average lesion scores varied across skeletal muscles but were generally lower in the mid and high dose groups. (C) A heat map demonstrating lesion severity in skeletal muscle and cardiac samples from all dogs obtained at Day 90. (D) Representative images from each dose group of muscle collected at necropsy and stained with Masson’s trichrome (left), together with a histogram of mean collagen per group quantified as a percent of area (right). (E) Data presented as a histogram of relative frequency of fiber size using a bin of 5 μm and a maximum bin of 50 μm and mean fiber size for each dose group (left). Fiber size evaluation of biceps femoris muscles collected at necropsy using minimal Feret’s diameter measurements (right). Bar = 100μm in A and D.
