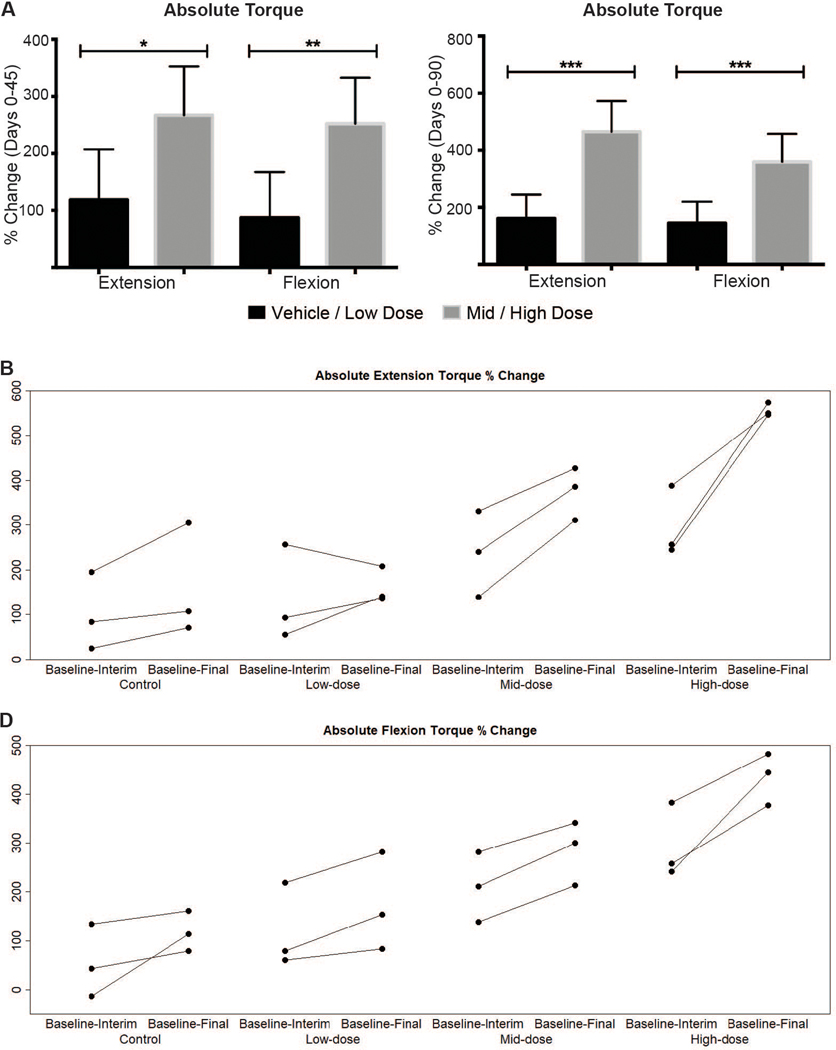
Fig. 5. Absolute tibiotarsal joint extension and flexion torque percent change for combined dose groups from baseline to Days 45 (interim) and 90 (final).
(A) Dose-related increases in the percent change for both absolute extension and flexion torque from baseline to Day 45 (left) and to Day 90 (right). Means and standard deviation for all study subjects within a dose group and time point are plotted. (B and C) Percent changes for extension (B) and flexion (C) torque plotted for individual dogs show evidence of a dose effect. Each dose group n = 3; combined dose groups n = 6. Combined ‘Control & Low dose’ versus ‘Mid & High dose’ groups were compared using the Mann-Whitney-Wilcoxon test. * P<0.05; ** P<0.01; *** P<0.001.

