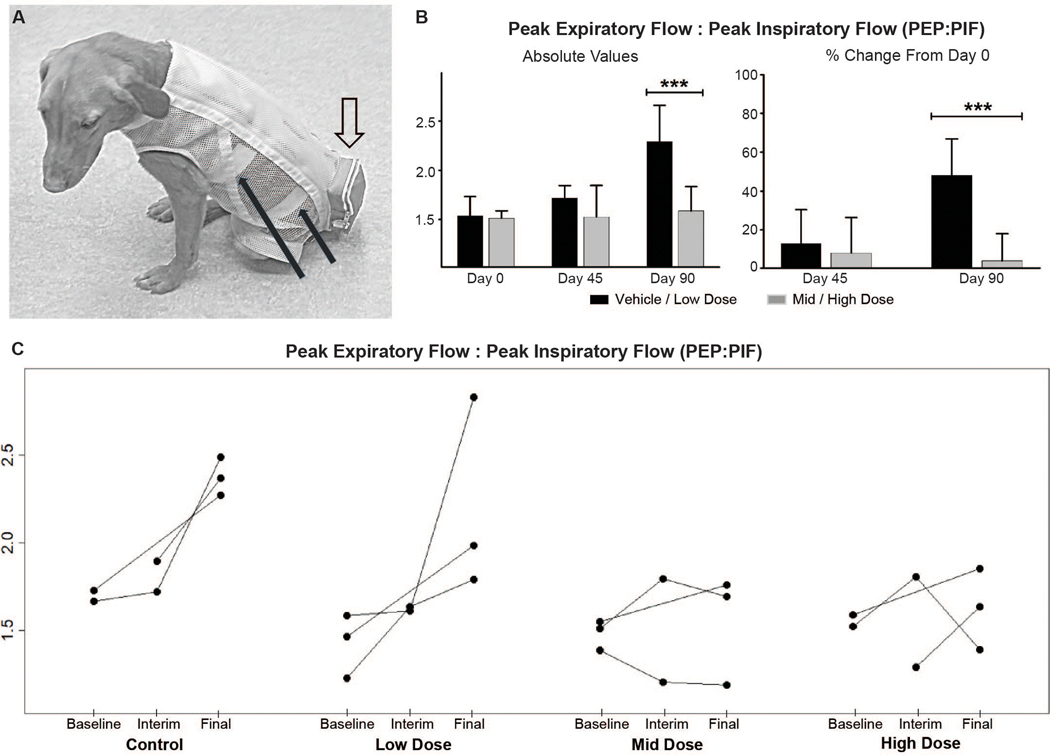
Fig. 6. Respiratory peak expiratory flow: peak inspiratory flow (PEF:PIF) ratios from baseline to end of study.
(A) Adult GRMD dog showing the instrumentation for respiratory inductance plethysmography (RIP). The solid black arrows point to the elastic inductance bands that circle the chest and the abdomen. The bands are looped through an inner lycra undershirt. Leads from the bands pass through the loose, outer mesh shirt and directly into the telemetry unit within the outer pouch (open arrow). (B) Graphs showing the absolute (left) PEF:PIF ratios at Day 90 and the percent change from Day 0 to Days 45 and 90 (right). Each dose group n = 3; combined dose groups n = 6. Combined ‘Control & Low dose’ versus ‘Mid & High dose’ groups were compared using the Mann-Whitney-Wilcoxon test. *** P<0.001. (C) RIP peak expiratory flow:peak inspiratory flow (PEF:PIF) ratios for individual dogs show a dose effect, with a disease-associated increase in the control/low dose dogs compared to relative stability of values for the mid/high dose groups.

