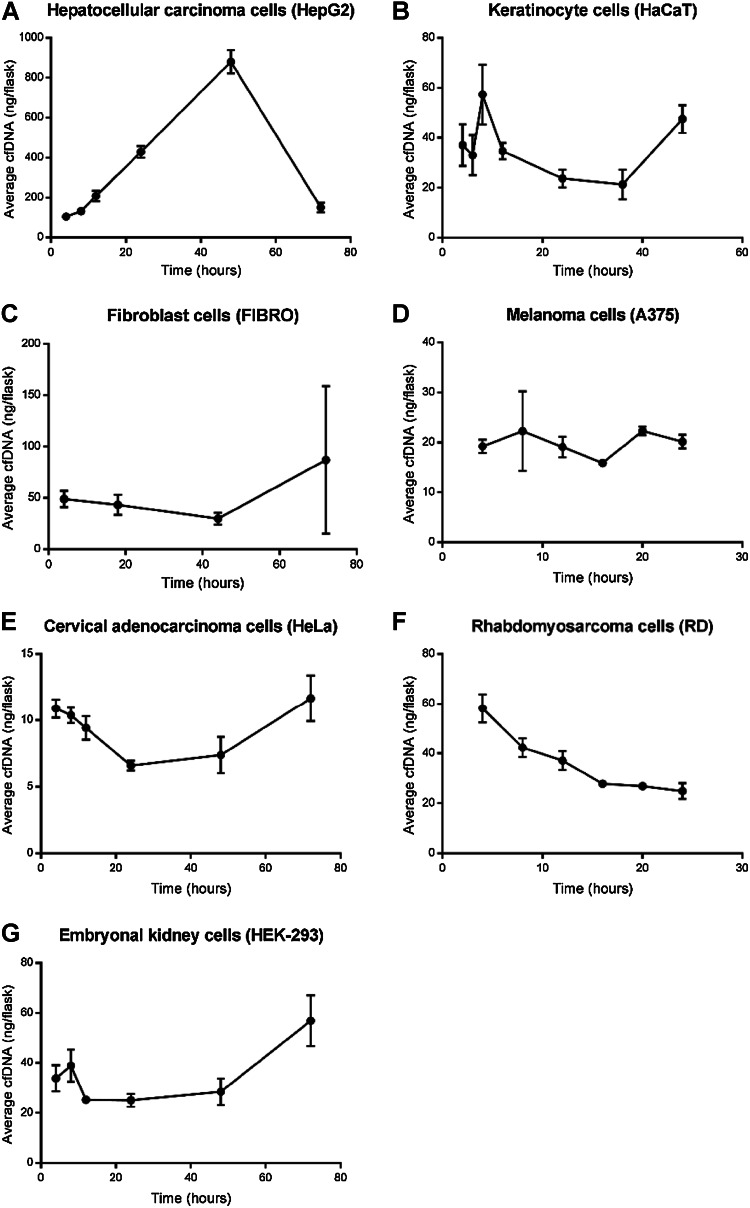
Fig. 1.
CfDNA levels (ng/flask) of a HepG2, b HaCaT, cFIBRO, d A375, e HeLa, f RD, and g HEK-293 cell lines after several time intervals of incubation following medium renewal. The value of each bar represents the average (±SD, n = 6) amount of cfDNA released in 12 mL of growth medium at each time interval

