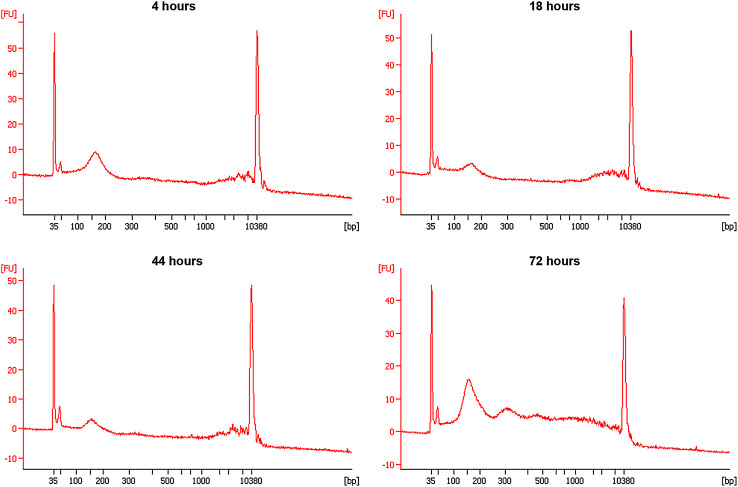
Fig. 5.
Capillary electropherograms showing the sizes of cfDNA isolated from FIBRO cells after 4–72 h of incubation following medium renewal. Very prominent in each electropherogram is the peak at 100–200 bp. This peak is associable with apoptosis and becomes exceptionally prominent at 72 h of incubation. Also visible in each electropherogram is a typical ladder patter associable with multiple nucleosomal subunits. The entire baseline is elevated at 72 h of incubation as an indication of the presence of variable fragment sizes ranging from 35 to 10,000 bp

