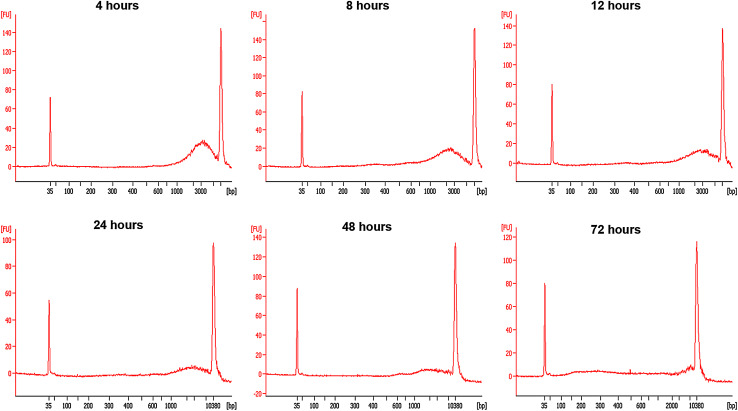
Fig. 7.
Capillary electropherograms showing the sizes of cfDNA isolated from HEK-293 cells after 4–72 h of incubation following medium renewal. The electropherograms show no indications of smaller peaks. Instead, a peak with maximal fluorescence is visible at 2000–3000 bp. Once again, this peak diminishes over time, while slight disturbances in the baseline become visible after 8 h of incubation

