
Fig. 1 |. Molecular and immune predictors of response.
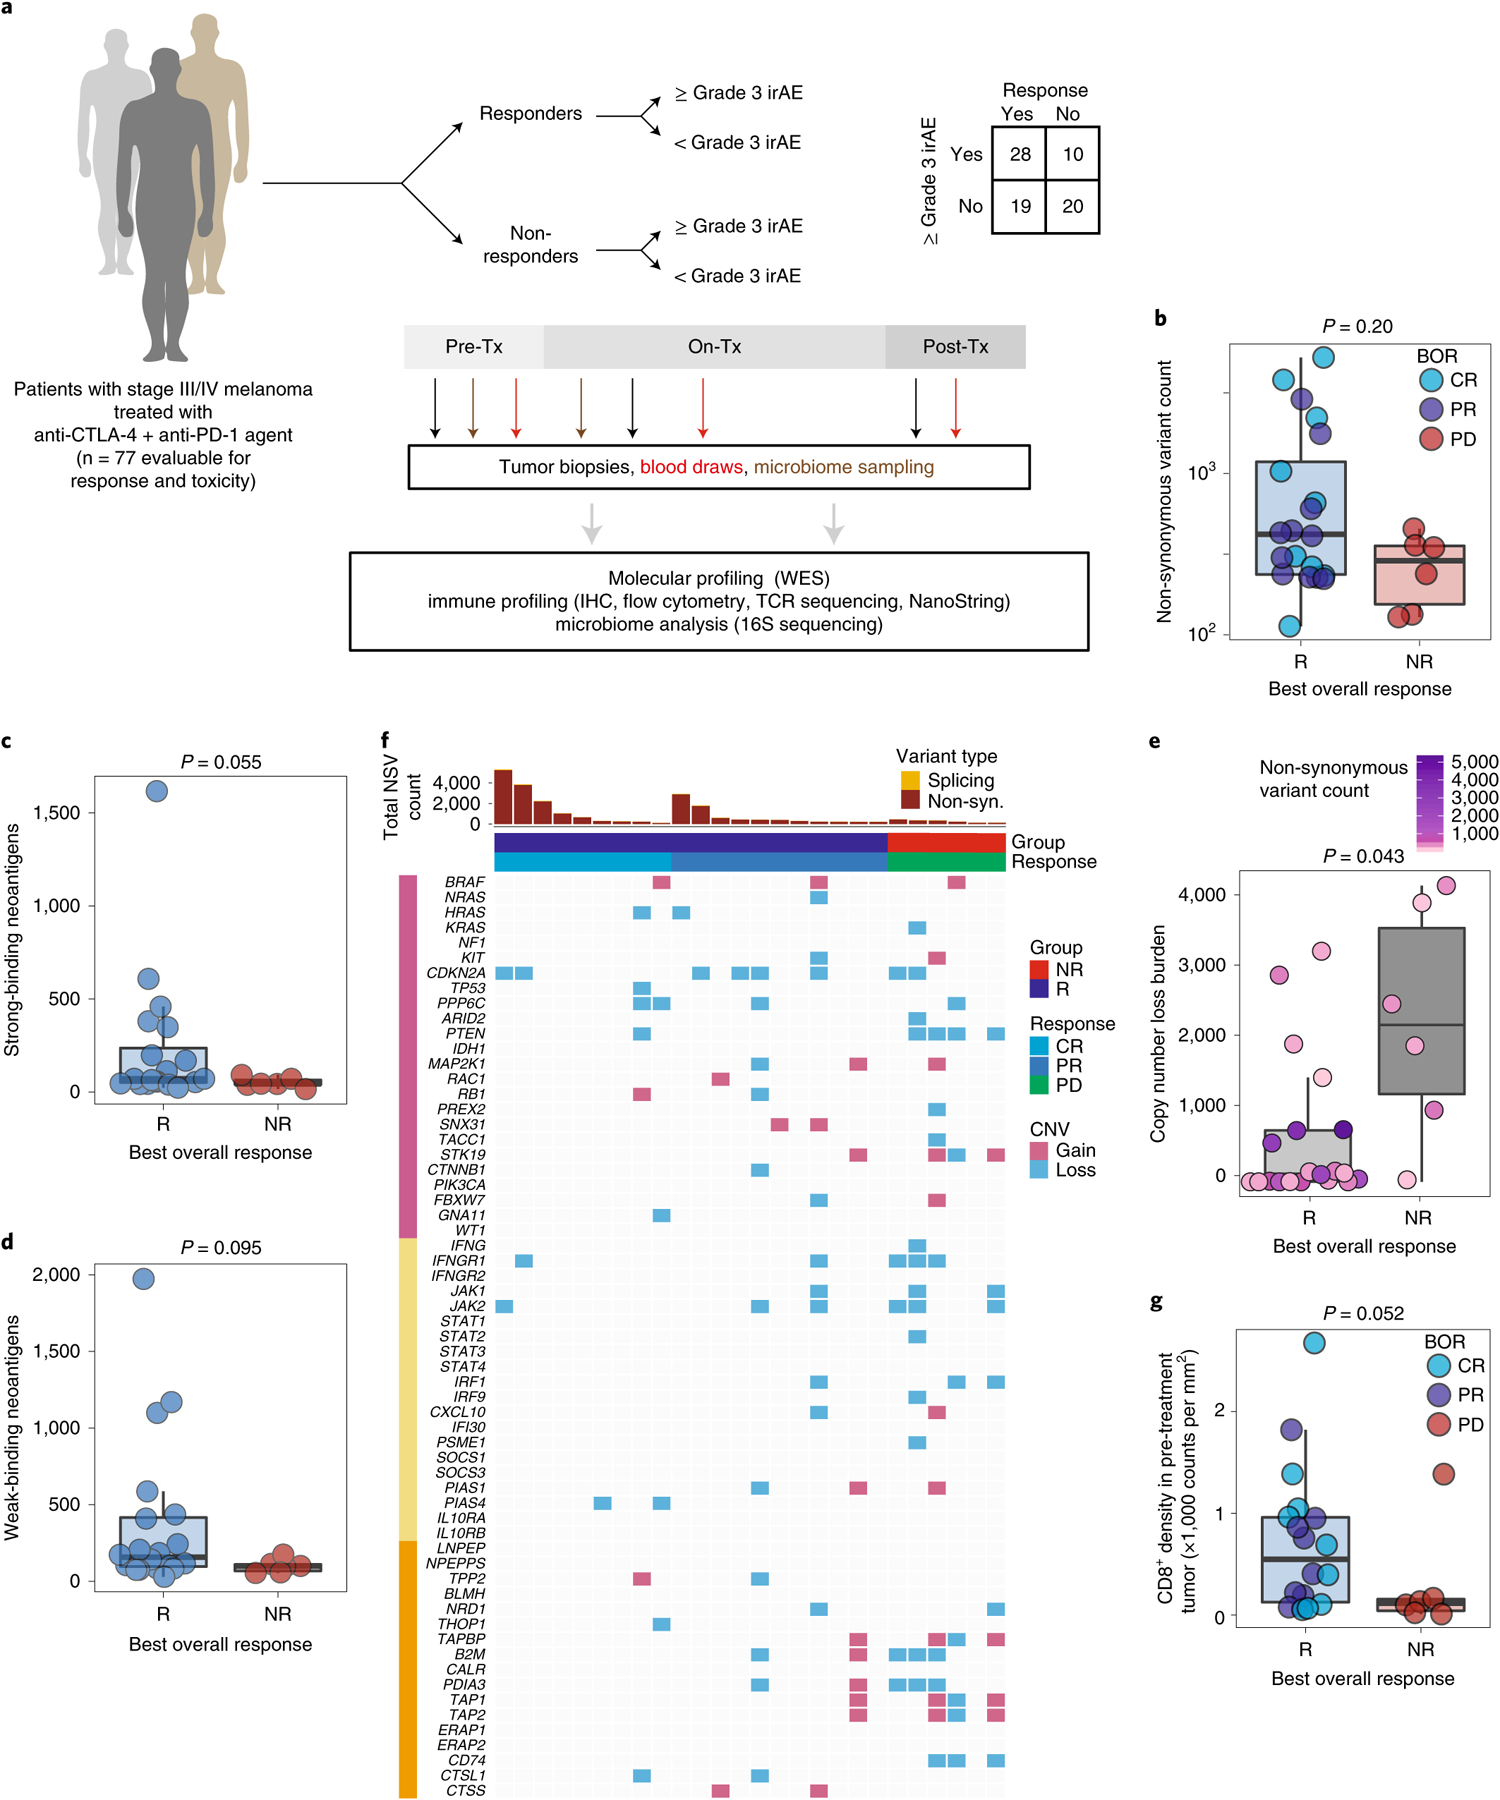
a, Cohort of patients with advanced melanoma (n = 77) evaluated for clinical outcomes and correlative biospecimen analyses prior to and following initiation of combined anti-CTLA-4 and anti-PD-1 blockade. Tx, treatment. b, Non-synonymous variant (NSV) count in pre-treatment tumor samples (n = 26) grouped by binarized best overall response (BOR) (R, responder, n = 20; NR, non-responder, n = 6; CR, complete response; PR, partial response; PD, progressive disease). Specific objective responses are indicated by the color of each data point (Mann–Whitney test, P = 0.20). c,d, Strong (c) and weak (d) binding neoantigen predictions grouped by best overall response as in b (Mann–Whitney test, P = 0.055 (c) and P = 0.005 (d)). e, Copy number loss burden (affected genomic regions) in pre-treatment tumor samples (n = 26) grouped by binarized best overall response (Mann–Whitney test, P = 0.043). Tumor mutation burden is indicated for each sample by color. f, Oncomap of copy number alterations affecting genes belonging to three groups: commonly mutated or copy number altered in melanoma (pink), IFN-γ related signaling (yellow) and antigen processing (orange). g, Density of infiltrating CD8+ cells (counts per mm2) in pre-treatment tumors by singlet stain immunohistochemistry grouped by binarized response (n = 19 R, n = 6 NR; one-sided Mann–Whitney test, P = 0.052). Box plots present the median bar with the box bounding the interquartile range (IQR) and whiskers the most extreme points within 1.5× IQR. All statistical tests are two-sided except where otherwise specified.