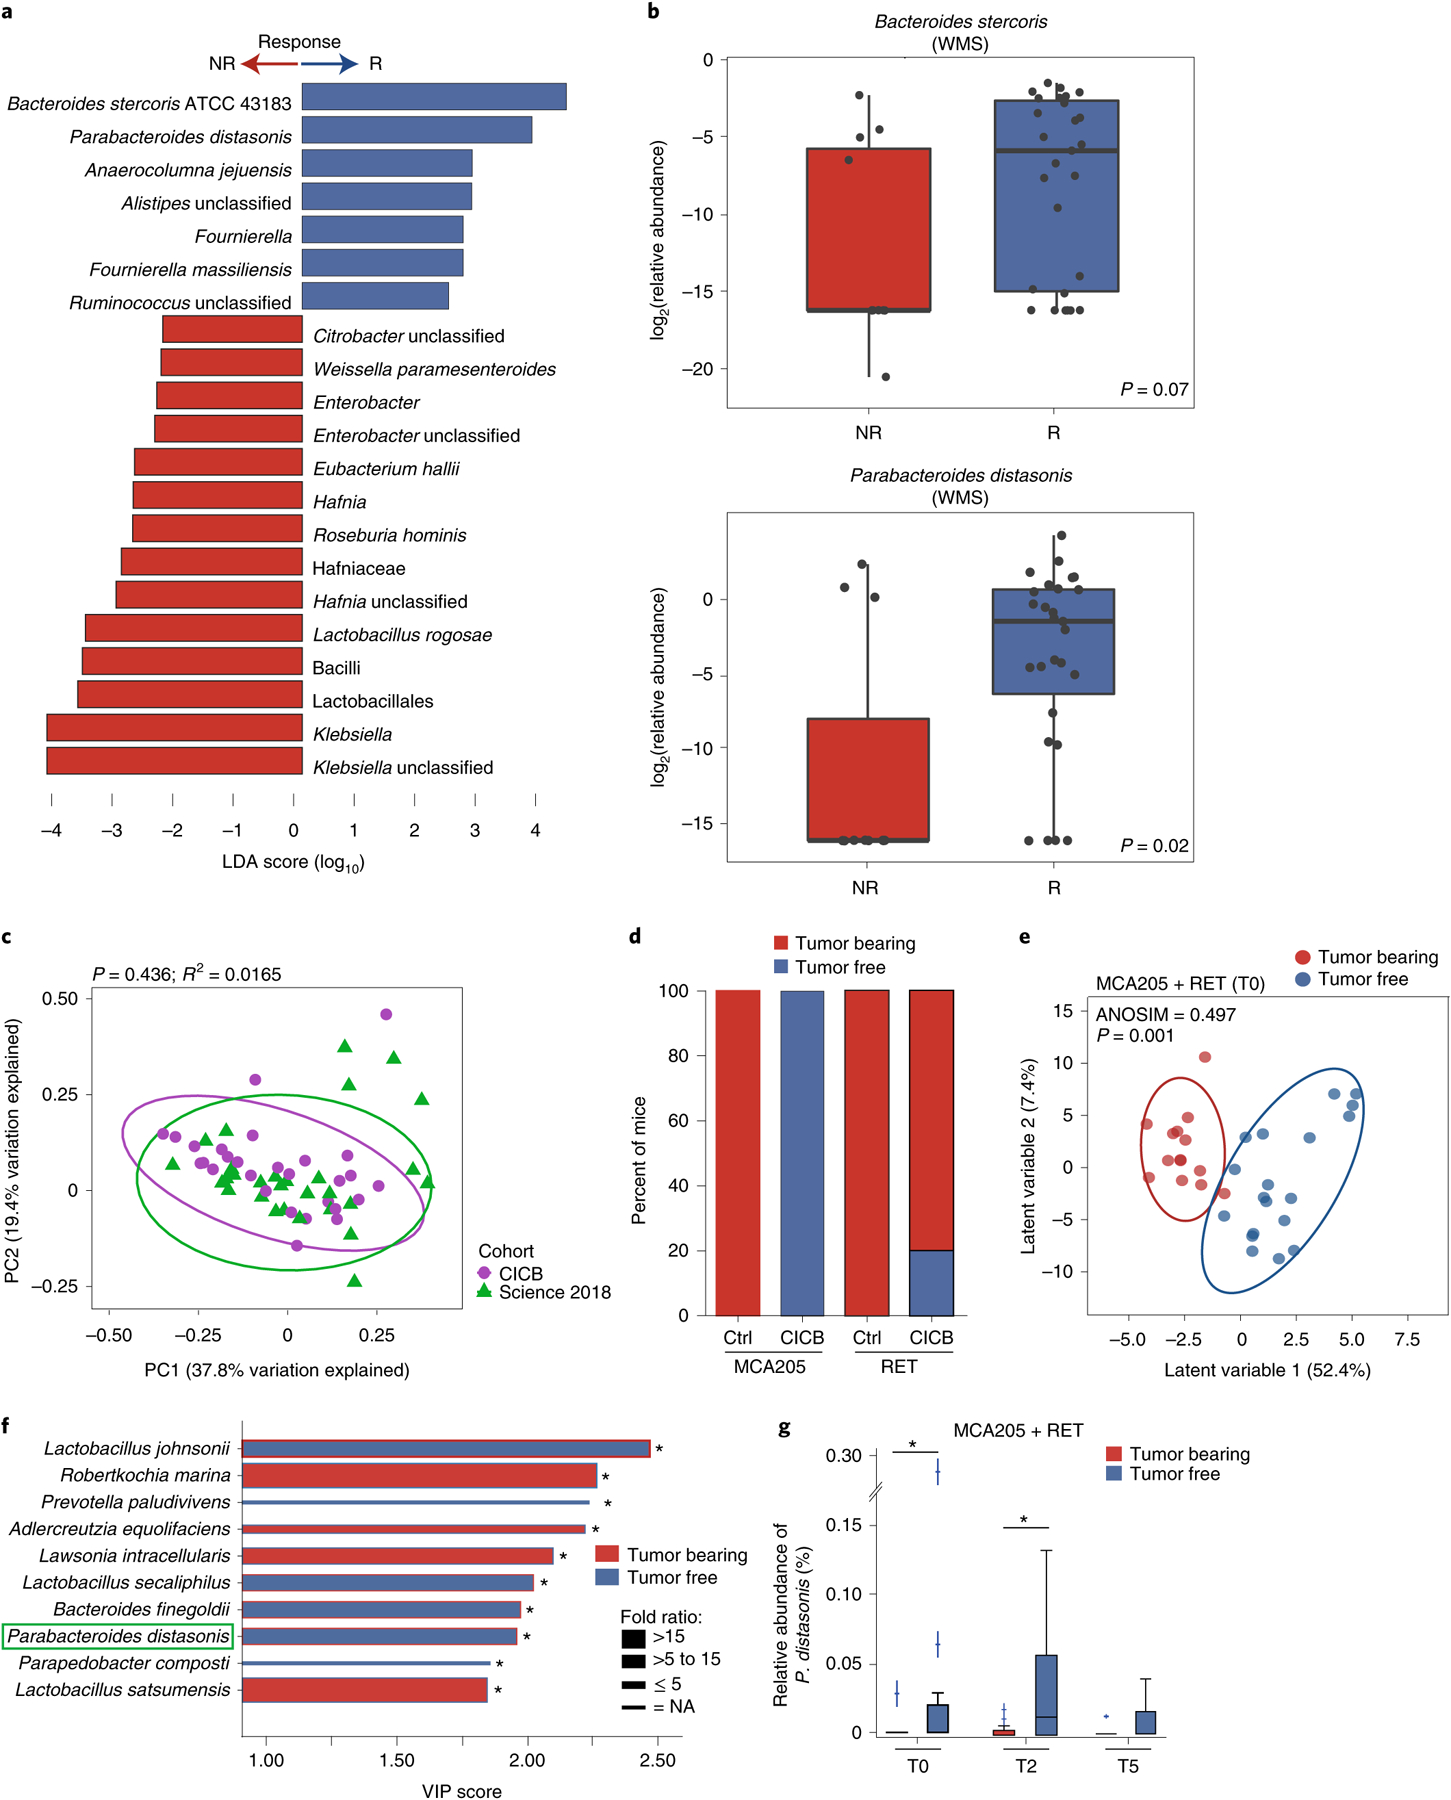
Fig. 2 |. Gut microbial associations with CICB response.

a, Linear discriminant analysis score plot using the Mann–Whitney test of bacterial taxa significantly enriched in patients, either responders (n = 29) or non-responders (n = 11) to CICB, from the cutaneous and unknown primary cohort (n = 40; P < 0.05). b, Abundance of candidate response taxa determined by WMS compared between response groups (total n = 38 patients with cutaneous melanoma: n = 27 R, n = 11 NR). Mann–Whitney test (top, P = 0.07; bottom, P = 0.02). Box plots present the median bar with the box bounding the IQR and whiskers the most extreme points within 1.5× IQR. c, Comparison of gut microbial composition in responders to CICB (n = 29; ‘CICB’, purple) and responders to anti-PD-1 monotherapy in our previously published cohort (n = 30; ref.21, ‘Science 2018’, green) as determined by ordination of beta diversity (weighted UniFrac, PERMANOVA P = 0.436). d, Percentages of tumor-free versus tumor-bearing mice after four intraperitoneal administrations of anti-PD-1 Ab + anti-CTLA-4 mAb (CICB) or isotype control mAbs (Ctrl) used to treat day 7 established MCA205 or RET tumors (n = 24 mice per group, pooled data from two experiments). e, PLS-DA plot of the variance in beta diversity at T0, between CICB-treated mice that were eventually tumor-free or tumor-bearing at euthanasia, in both tumor models combined. ANOSIM defines the separation of the groups; the P value defines the significance of such separation after 999 permutations of the samples (ANOSIM = 0.497, P = 0.001). f, VIP score barplot highlighting bacterial species present at T0 significantly enriched in the group defined by the bar color (highest mean relative abundance) compared to the group defined by the border color (lowest mean relative abundance), indicating mice that were eventually tumor-free versus tumor-bearing following CICB treatment (RET and MCA205 models). An absent border indicates a mean relative abundance of zero in the compared cohort(s). The green box highlights a species in common with patient data. Mann–Whitney test: *P < 0.05; NS, not significant. Bar thickness reports the fold ratio value of the mean relative abundances for each species among the two cohorts. NA, not applicable. g, Relative abundance of P. distasonis (at T0, T2 and T5) in tumor-free and tumor bearers over time. *P < 0.05 by Mann–Whitney test. Error bars represent the mean ± s.e.m. All statistical tests are two-sided except where otherwise specified.
