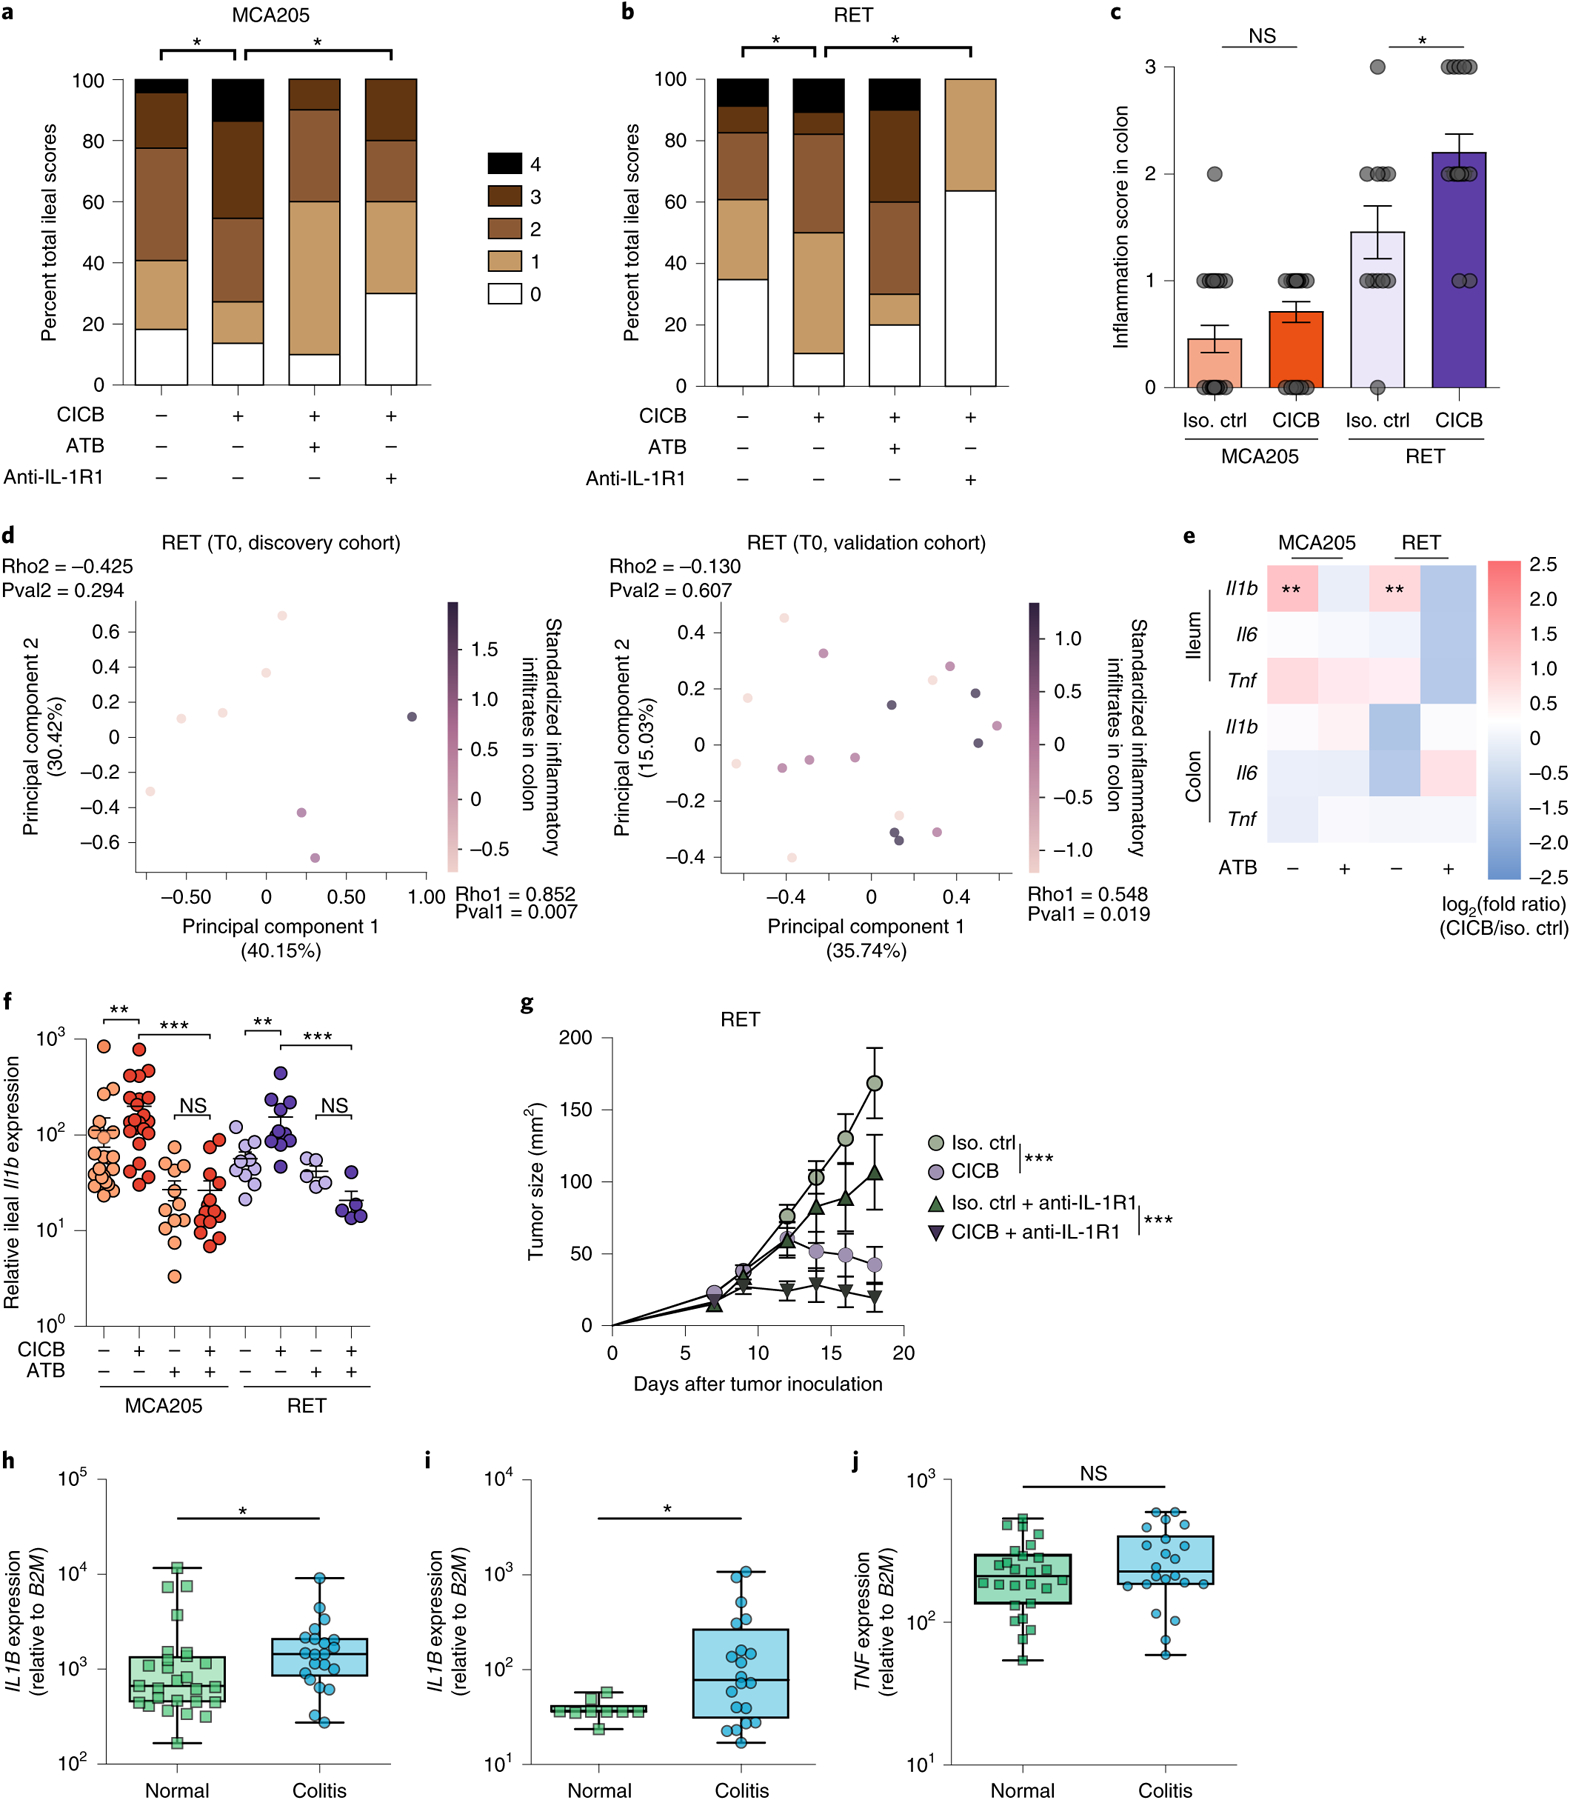
Fig. 3 |. Role of gut microbiota and ileal IL-1β in CICB-induced intestinal inflammation in tumor-bearing mice.

a,b, Scoring (range 0–4) of hematoxylin and eosin-stained inflammatory infiltrates and pathological lesions of the ilea in MCA205 (a; P = 0.042) or RET (b; P = 0.024) tumor-bearing mice treated with isotype control or CICB, ± antibiotics (ATB) or with the IL-1R1 antagonist, anakinra, 24 h after at least one CICB injection (n = 9–22 per group). Student’s t-test. c, Scoring of inflammatory colonic lesions in MCA205 and RET tumor-bearing mice analogous to that shown in a and b (Mann–Whitney test, P = 0.018). Error bars represent mean ± s.e.m. d, Beta diversity ordination (Bray–Curtis dissimilarity) of the fecal microbiota assessed by sequencing of 16S rRNA gene amplicons colored according to score of colonic inflammatory infiltrate in RET tumor-bearing mice. Intensity of the purple indicates increasing inflammatory infiltrate score in the discovery (left) and validation (right) cohorts. Bacterial relative abundances and colonic inflammatory infiltrate were both normalized and standardized before correlation analysis. Pearson correlation and associated P values comparing each principal component with inflammatory infiltrate are indicated (discovery P = 0.294, ρ = −0.425; validation P = 0.607, ρ = −0.130). e, Heatmap of log2(fold change) of pro-inflammatory immune gene expression (CICB-treated versus isotype) in ilea and colons of MCA205 and RET tumor-bearing mice ± ATB. n = 10–22 mice per group. Mann–Whitney test: MCA P = 0.0032, RET P = 0.0016. f, Relative ileal Il1b expression in tumor-bearing mice treated with isotype/CICB ± ATB. n = 10–22 mice per group. Mann–Whitney test: *P < 0.05, **P < 0.01, ***P < 0.001; NS, not significant. g, Tumor growth kinetics of RET melanoma in mice treated with CICB ± IL-1R1 antagonist anakinra. Data presented as mean ± s.e.m. tumor sizes from a representative experiment of two yielding similar results, comprising six mice per group. ANOVA test: ***P < 0.001. Error bars represent mean ± s.e.m. h–j, qPCR measurement of the relative IL1B (h; P = 0.042), IL17 (i; P = 0.041), TNF (j; NS) expression in colon samples from patients with melanoma experiencing immune-related colitis following ICB comparing areas of active inflammation (colitis) with areas of normal colonic tissue (‘normal’; intra-patient or cancer-free controls) (*P < 0.05, Mann–Whitney test). Box plots present the median bar with the box bounding the IQR and whiskers the most extreme points within 1.5× IQR. Additional details are provided in Supplementary Table 7. All statistical tests are two-sided except where otherwise specified.
