
Extended Data Fig. 2 |. Fecal microbiome composition and diversity at baseline in CICB-treated patients.
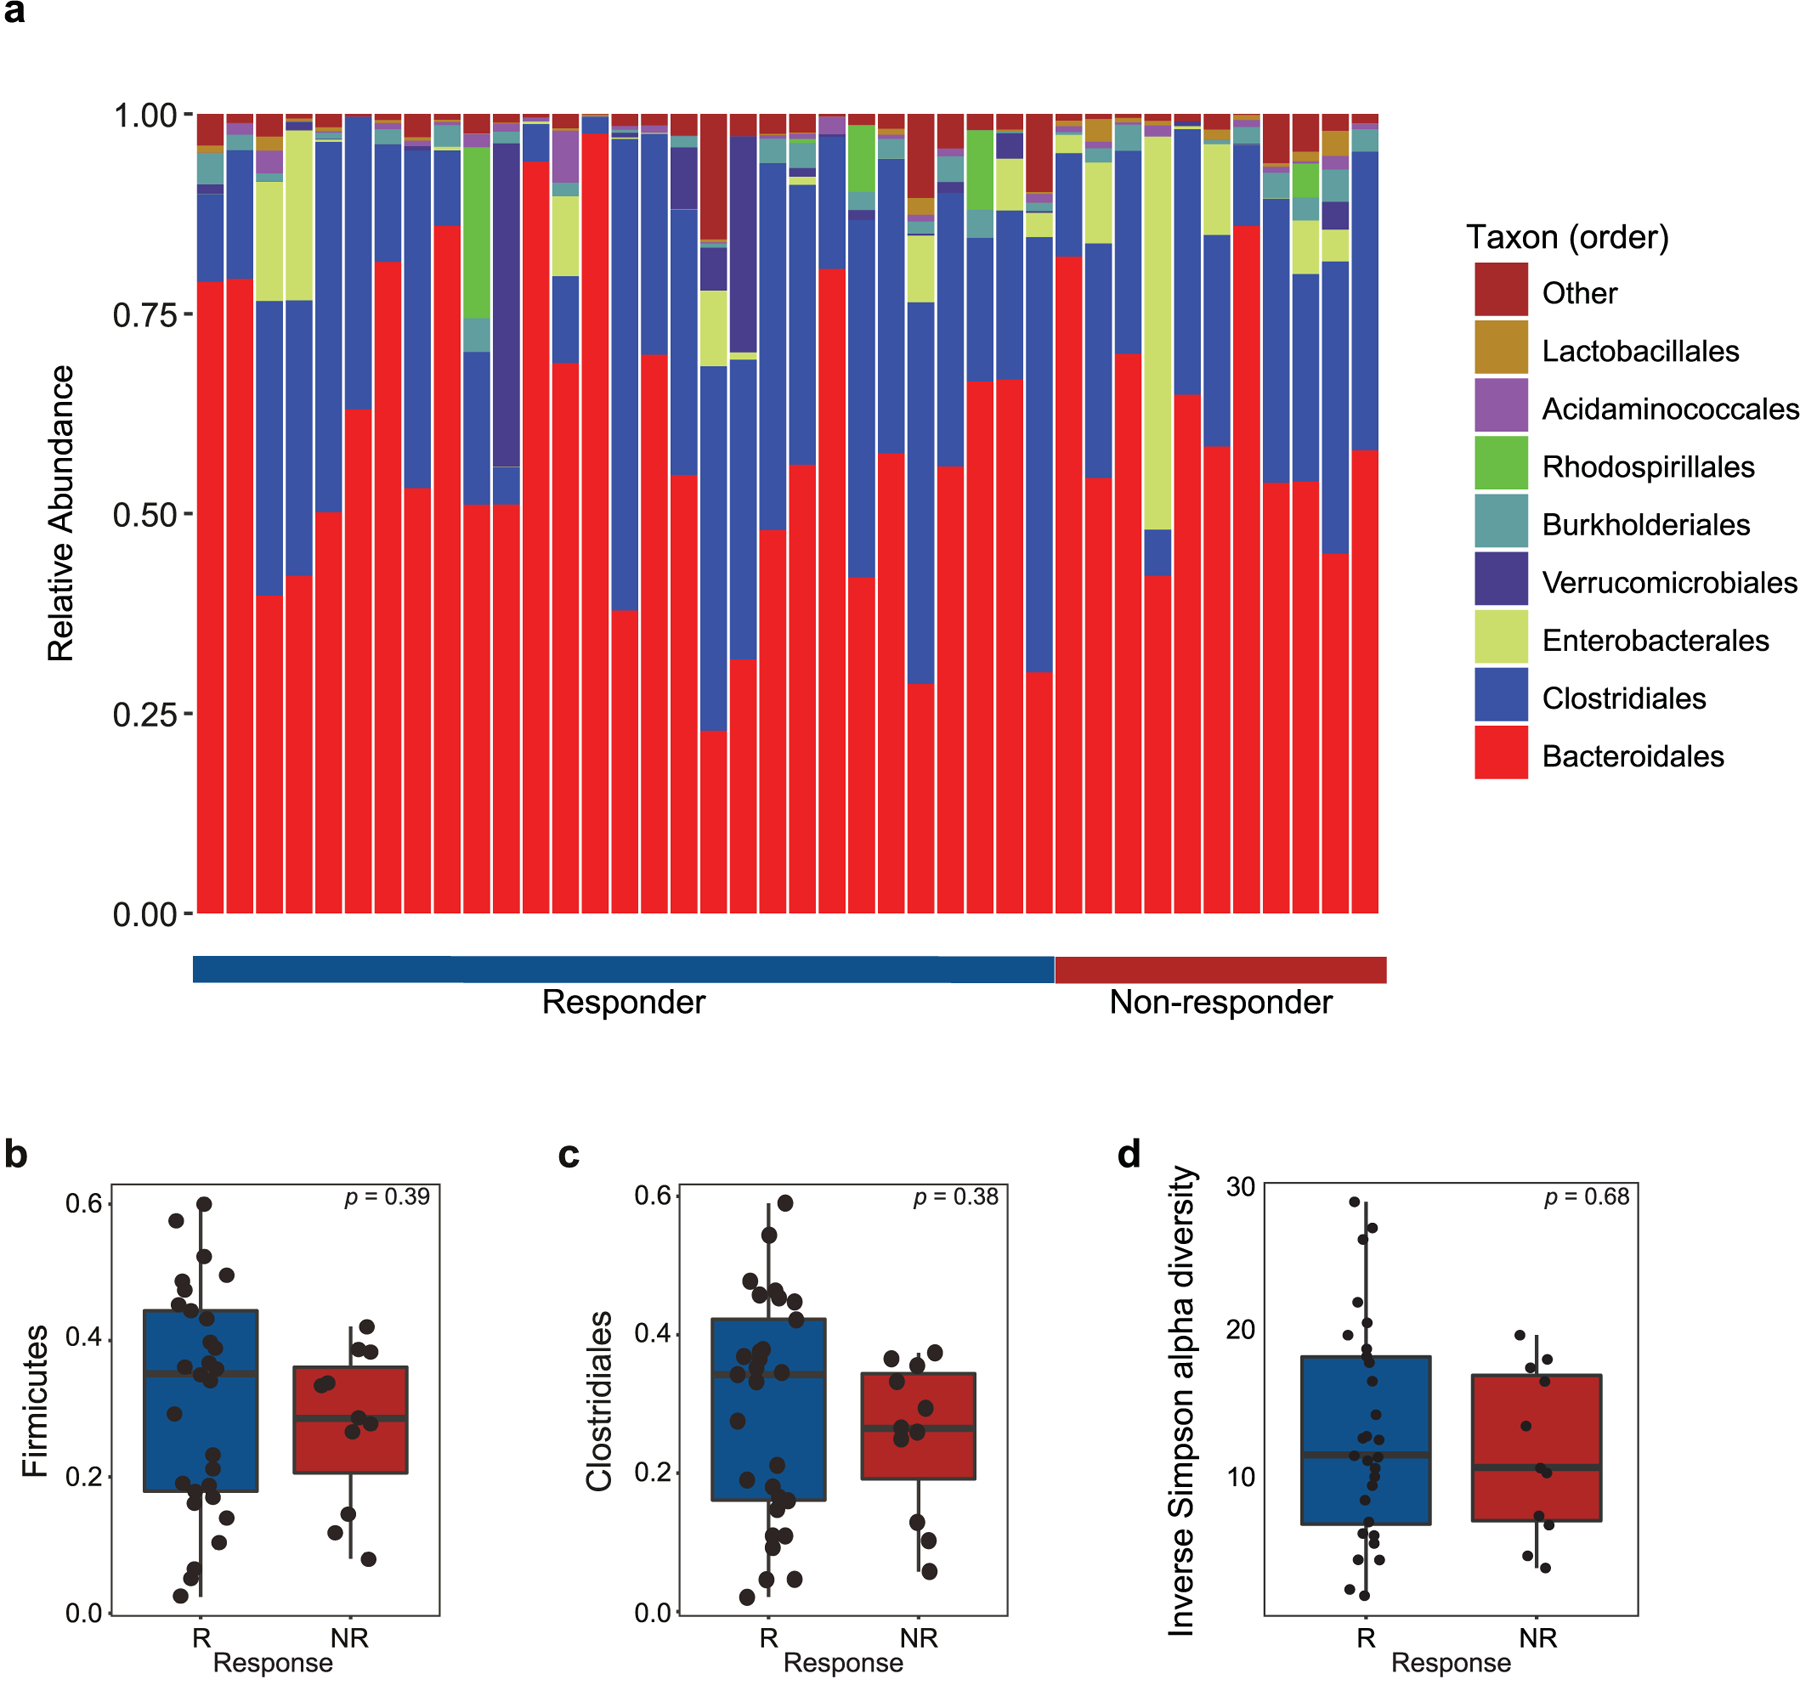
a, Stacked bar plot depicting 16S microbial composition of each analyzed fecal sample from the cutaneous and unknown primary cohort at the order level (n = 39). b,c, Comparison of group-wise abundances of Firmicutes (b) (p = 0.39) and Clostridiales (c) (p = 0.38) by response outcome in the cutaneous/unknown primary cohort (n = 39). d, Inverse Simpson alpha diversity of the fecal microbiome grouped by response in CICB-treated patients with cutaneous or unknown primary melanomas (n = 39) taken at baseline (p = 0.68, Mann-Whitney test; R=responder, NR=non-responder). Box plots present the median bar with the box bounding interquartile range (IQR) and whiskers to the most extreme point within 1.5 × IQR. All tests are two-sided unless otherwise specified.