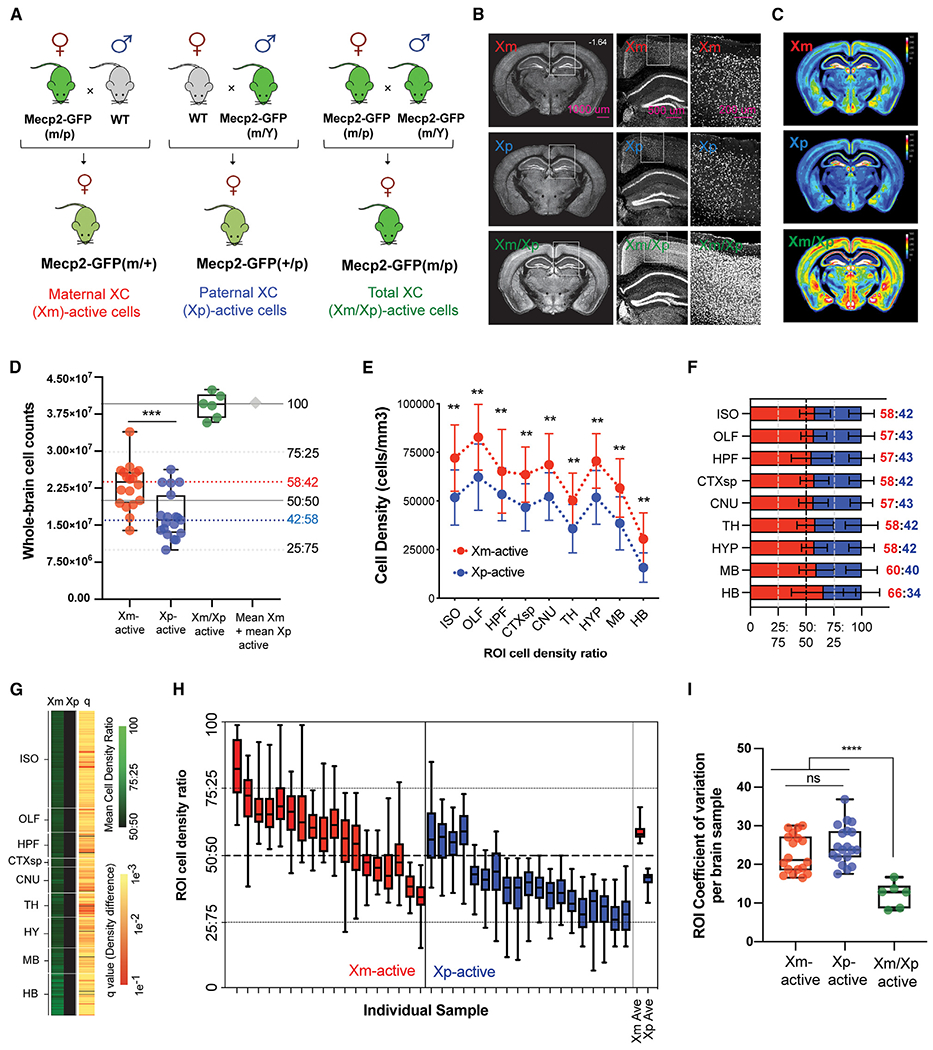
Figure 1. Whole-brain quantification of maternal and paternal active X chromosome distribution.

(A) Breeding strategy for generating maternal, paternal, and homozygous Mecp2-GFP reporter mice.
(B) Representative STPT images from brains with maternal (Xm; top), paternal (Xp; middle), and homozygous (Xm/Xp; bottom) Mecp2-GFP+ cells.
(C) Mean Mecp2-GFP+ cell density across genotypes represented as voxelized heatmaps on a 16-color gradient scale from black (0 cells/voxel) and yellow (150 cells/voxel) to white (300 cells/100 μm sphere voxel).
(D) Whole-brain cell counts for Xm-GFP+ (n = 18), Xp-GFP+ (n = 19), and homozygous Xm-GFP+/Xp-GFP+ cells (n = 6). ***p < 0.0005, Welch’s t test. The sum of the heterozygous Xm-GFP+ and Xp-GFP+ cell counts is shown as a gray diamond. Dashed red and blue lines show the data-derived Xm-active and Xp-active median ratios, respectively.
(E) Mecp2-GFP+-labeled cell densities (cells/mm3) across all major ontological brain divisions. **p < 0.01, two-way mixed-effects ANOVA with Holm-Sidak-corrected post hoc test.
(F) Data from (E) converted into stacked cell density ratios. Data from (E)–(F) represent mean ± SD.
(G) XCI selection across all atlased brain regions. Left two columns: heatmap visualization of normalized mean Xm-active and Xp-active region of interest (ROI) cell density on a color gradient of black (50%) to green (100%). Right column: statistical significance across all ROIs (false discovery rate [FDR]-corrected Student’s t tests), with each q value indicated by a color gradient from red (0.1) to yellow (0.001).
(H) Stochastic variability of XCI selection across all brain regions in each brain analyzed. The average data for Xm-GFP and Xp-GFP brains are plotted on the far right. Box-and-whisker plots display median, interquartile range, and 95th percentiles of the data.
(I) Quantification of brain-wide ROI stochastic variability by coefficient of variation (CV) analysis. ***p < 0.005 from one-way ANOVA with Dunnett’s post hoc test. Box-and-whisker plot data from (D), (H), and (I) display median, interquartile range, and 95th percentiles of the data.
