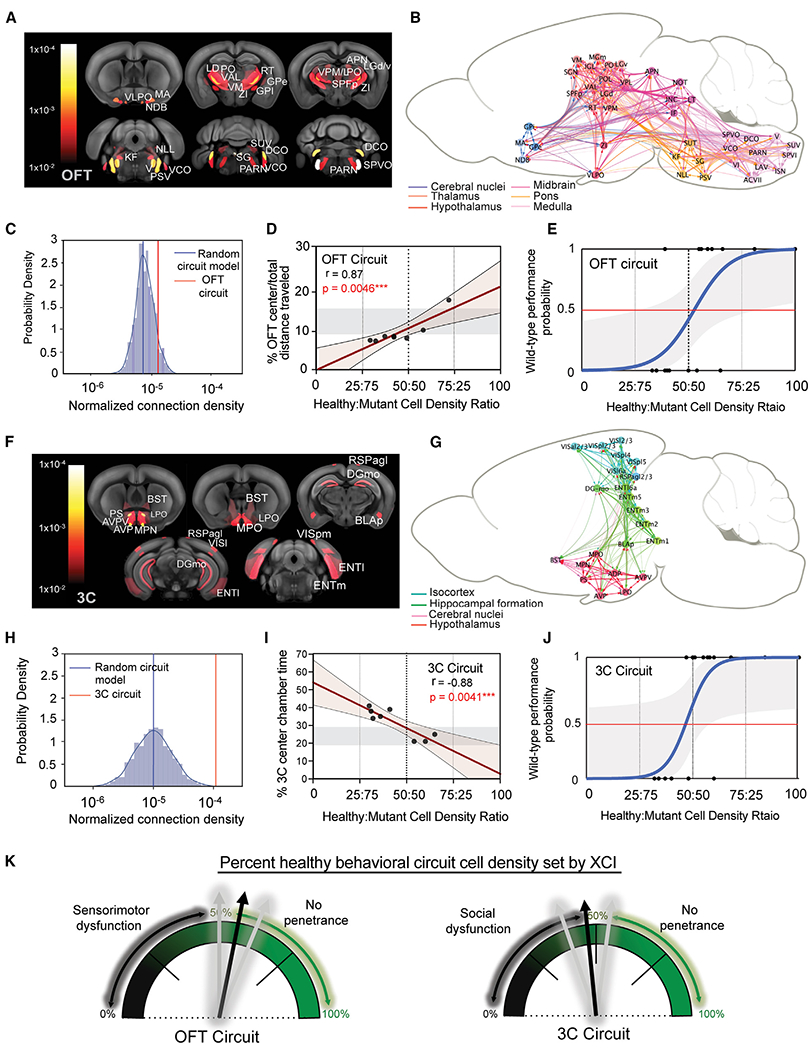
Figure 4. Distinct intact brain circuitries represent anatomical correlates of FXS behavioral outcomes.

(A and F) Select ROIs from maternal Fmr1-KO(m)/Mecp2-GFP(p) mice with significant correlation (cutoff at p = 0.01)to performance in (A) OFT and (F) 3-chamber tests are heat mapped and overlaid on a reference mouse brain template.
(B and G) Visualization of structural connectivity weights within behaviorally correlated brain networks of ROIs in the (B) OFT and (G) 3-chamber tests.
(C and H) Log-scaled and normalized median connection densities of the (C) OFT and (H) 3-chamber ROI networks (red lines) overlaid on the probability density of 1,000 in-silico-generated random ROI networks of the same inter-regional distance and total ROI number (blue line = median). One-sample t test: OFT, p = 6.36 × 20−247; 3 chamber: p = 0.0.
(D and I) Linear regression models of behavioral scores and brain circuit cell density ratios. Regression and statistical test values are listed for each image. Shadowed rectangle in each group represents control Fmr1 WT range of behavioral scores for comparison.
(E and J) Logistic regression modeling of WT behavioral performance predicted by percentage of healthy cell density in behavioral circuits from all mice (n = 22) within (E) OFT (x2(1) = 14.88; log-likelihood ratio = −14.42; equal-odds ratio = 54%; p = 0.00011) and (J) 3 chamber (x2(1) = 13.88; log-likelihood ratio = −12.89; equal-odds ratio = 49%; p = 0.00019) behaviors. Grayed area represents ±95% confidence intervals.
(K) Cartoon depiction model of OFT (left) and 3-chamber (right) logistic modeling results, which portrays how female FXS phenotypes are determined by XCI-distributed healthy cell densities occupying the behavioral circuits identified in this study.
See Table S1 for all ROI acronyms.
