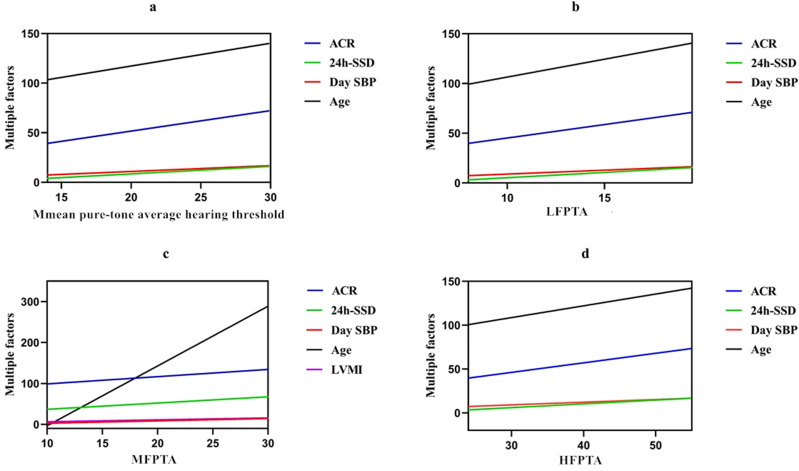
Figure 3.
Multivariate linear regression for participants with different hearing thresholds. The vertical coordinate is risk factors, and the horizontal coordinate is the hearing threshold. The slope represents the correlation coefficient. (a) denotes the comparison of the correlation coefficients among the factors influencing the mean pure-tone average hearing threshold. (b) indicates the comparison of correlation coefficients among factors that influence the LFPTA. (c) denotes the comparison of correlation coefficients among factors that influence the MFPTA. (d) represents the comparison of correlation coefficients among factors that influence the HFPTA.
Abbreviations: 24h-SSD, standard deviation of 24-hour systolic blood pressure; ACR, albumin-to-creatinine ratio; OR, risk ratio; Day SBP, day systolic blood pressure; LVMI, left ventricular mass index; LFPTA, the low-frequency pure-tone average hearing threshold; MFPTA, the medium-frequency pure-tone average hearing threshold; HFPTA, the high-frequency pure-tone average hearing threshold.

