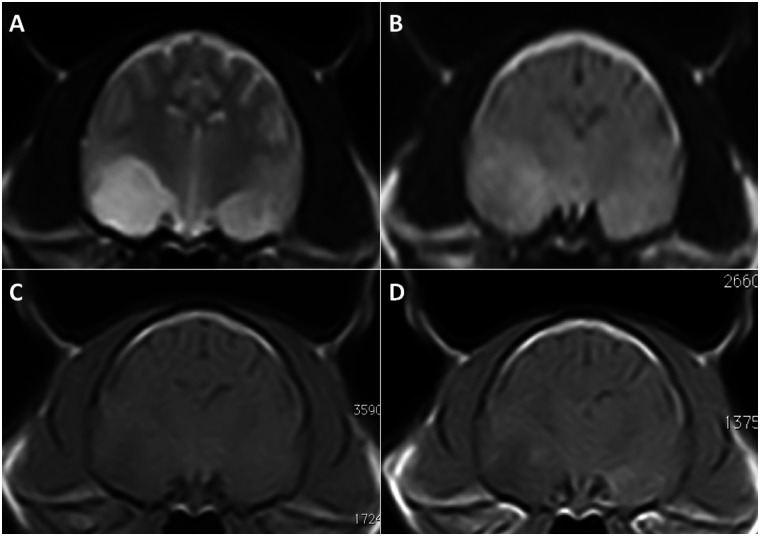
Figure 3.
Transverse T2W (a) and FLAIR (b) images, showing a moderate hyperintense signal in the area of both pyriform lobes. This hyperintensity affected a much larger area within the right pyriform lobe in comparison to the left. Transverse pre- (c) and post-contrast T1W images (d) demonstrate a similar hypointense area in the right pyriform lobe. The left pyriform lobe enhanced mildly on post-contrast T1W images (d)

