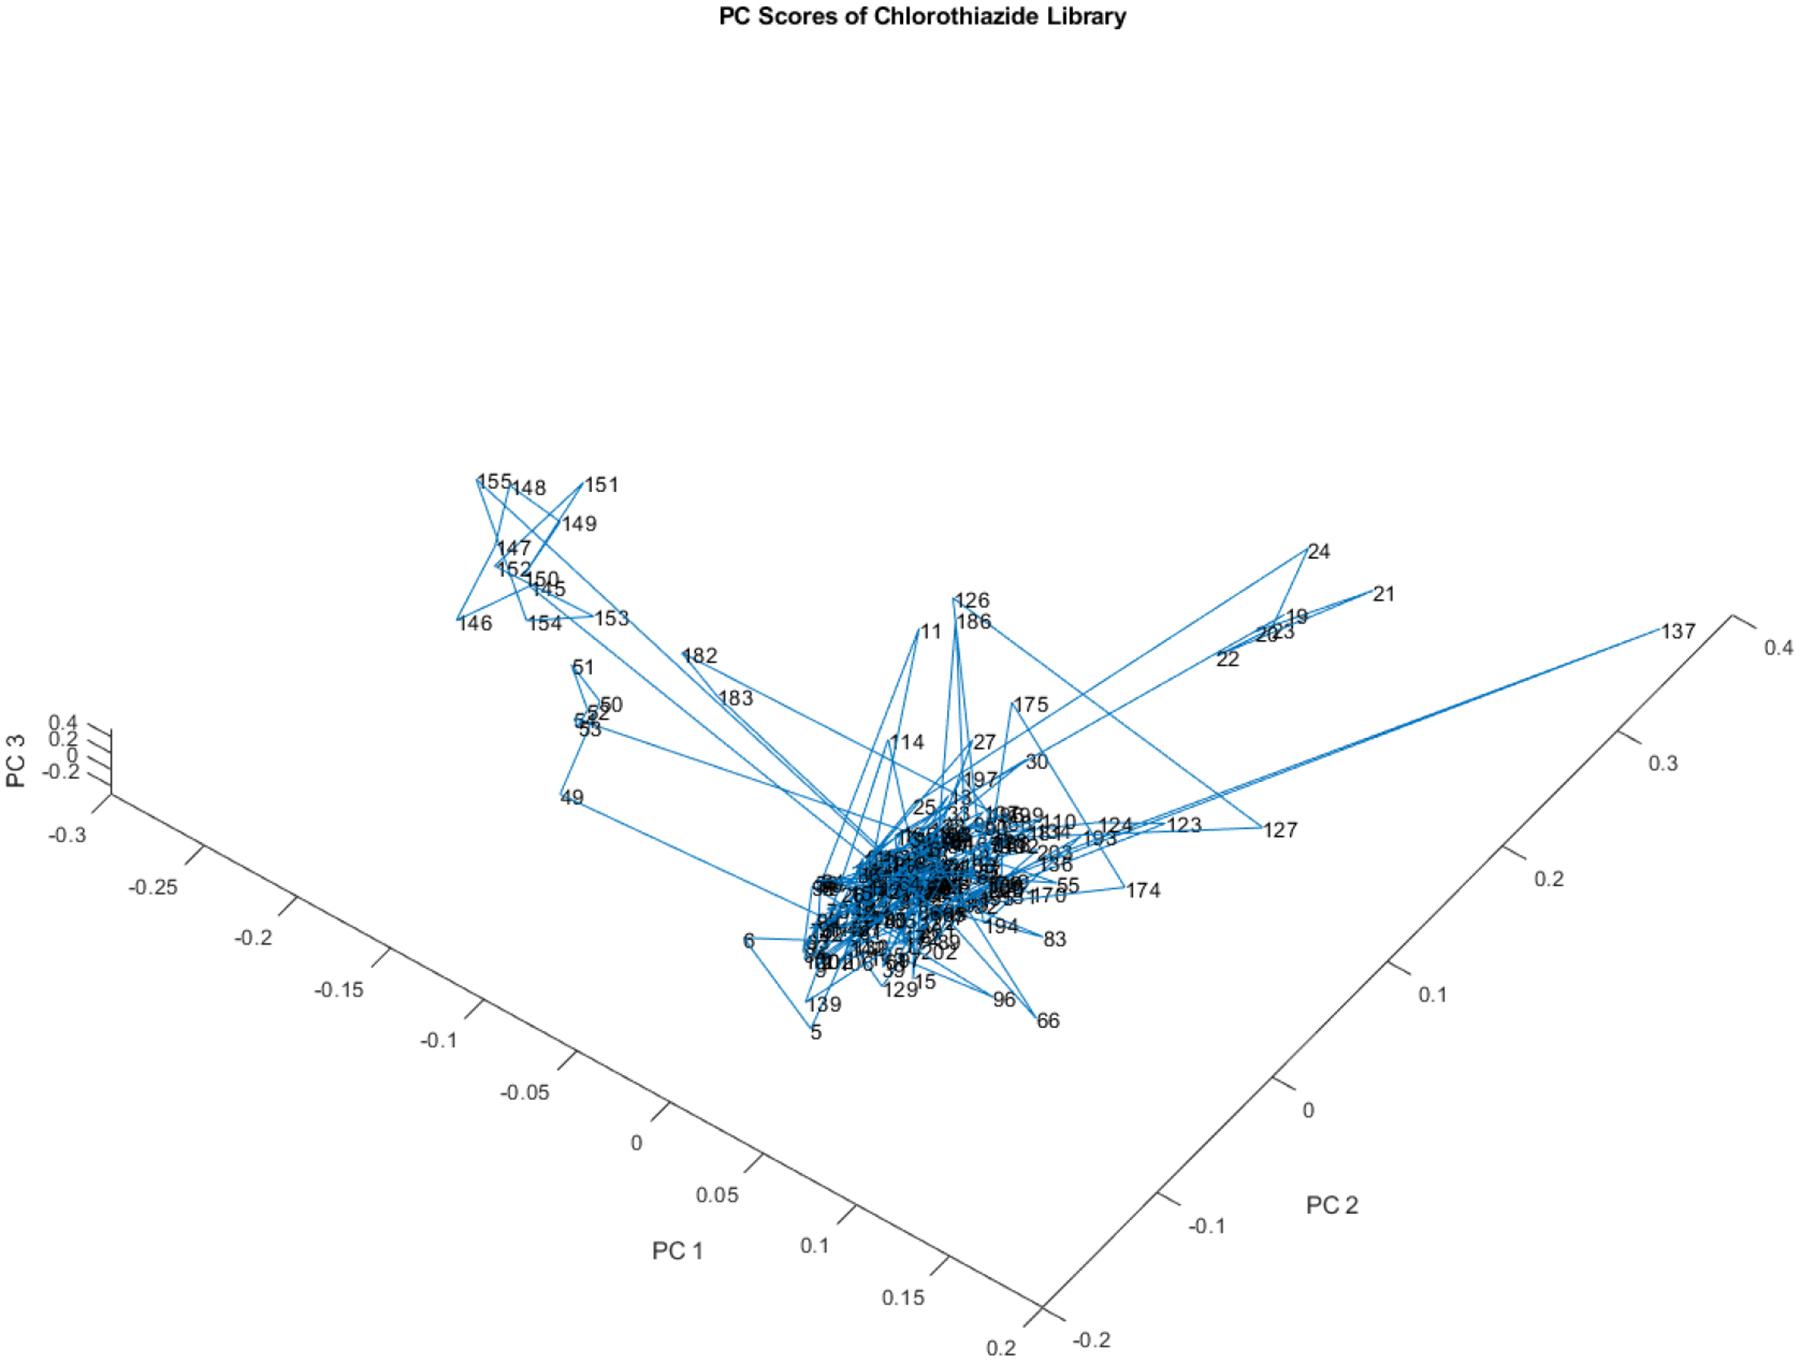
Figure 7.

Another rotated view of the principal component scores of the 204 vial spectra shown in Figure 4. One small subcluster appears to the right of the majority of the library and another slightly larger subcluster to the left. The two different subclusters derive from different lots.
