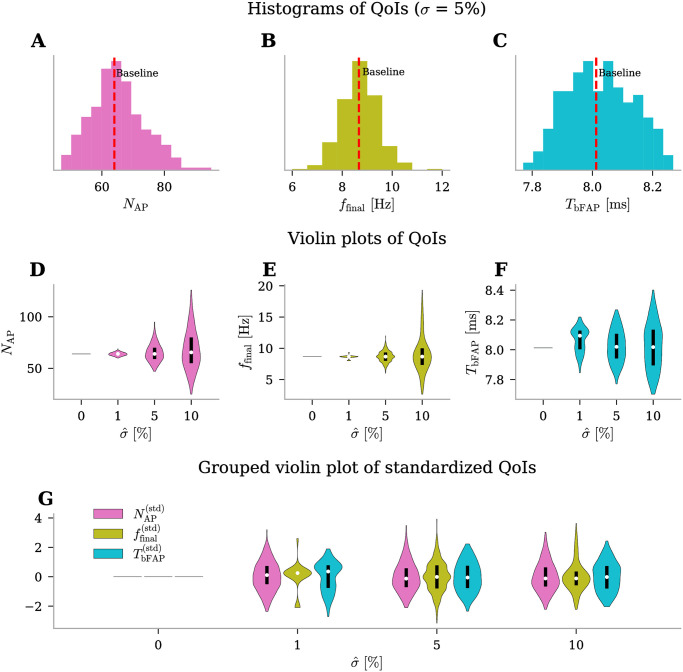
Fig 3. Uncertainty quantification for ϕmsn QoIs under physiological conditions.
Outputs for three QoIs (number of action potentials, NAP, final firing frequency, ffinal, and time before the first action potential, TbFAP). (A-C) Histograms of QoIs with moderate uncertainty level on input parameters, . The red dashed lines indicate the values of QoIs when the edNEG model is evaluated using baseline parameter values. (D-F) Violin plots of QoIs with increasing level of uncertainty in the input parameters, (x-axis). The width of each violin at any given point indicates the density of the QoI at the corresponding uncertainty level. The white dots represent the median and the black bold lines indicate the data that lie within quartiles. (G) Grouped violin plot of standardized QoIs ((data—mean)/standard deviation) with increasing level of uncertainty in the input parameters.

