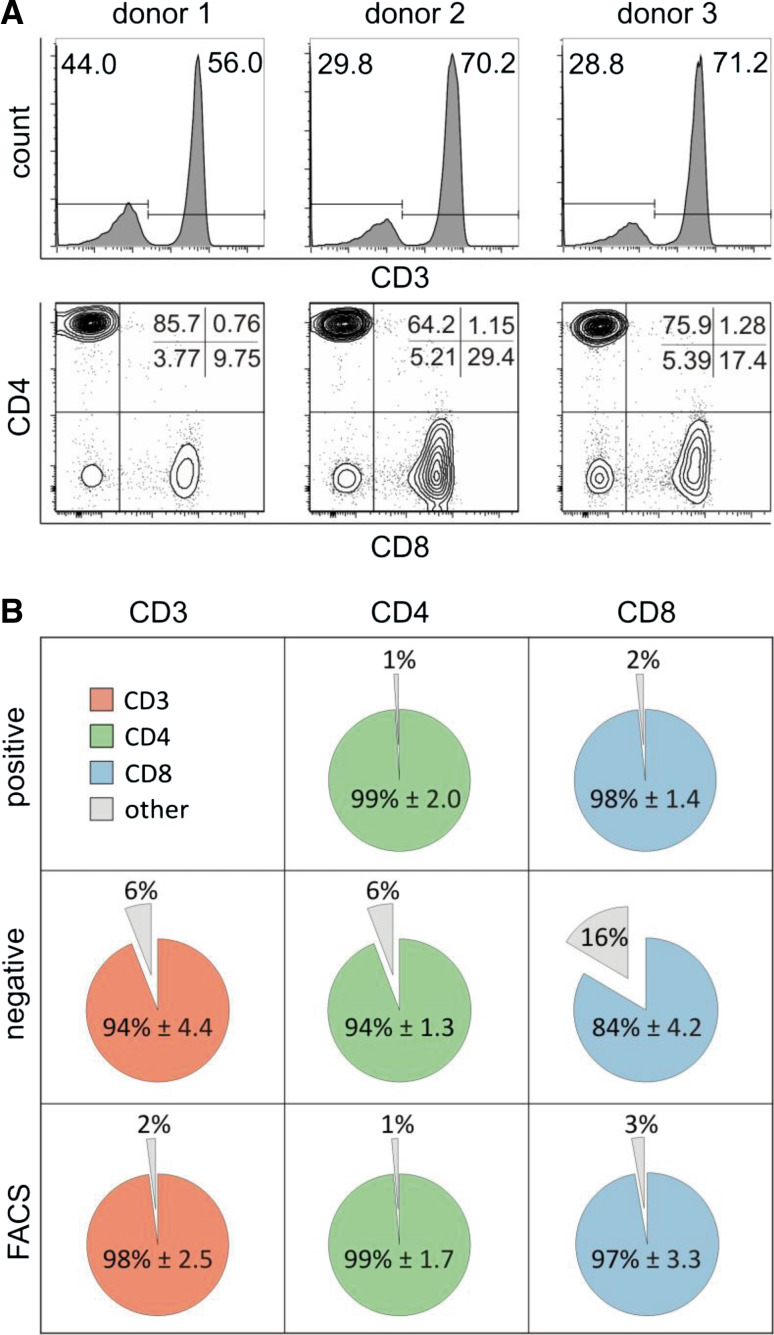
Fig. 2.
Cell purity. a Analysis of PBMC samples before isolation of subtypes. The CD3 cell subsets within PBMC of each donor are shown as histograms. CD3+ cells were selected to differentiate into CD4+ and CD8+ subtypes. Average percentages are displayed for each donor. b Purities of isolated CD3+, CD4+ or CD8+ subtypes are shown for positive selection, negative selection and FACS. Pie charts display the average percentages of CD3+, CD4+ or CD8+ subtypes across donors for each isolation method except for CD3 positively isolated (mean ± standard deviation)

