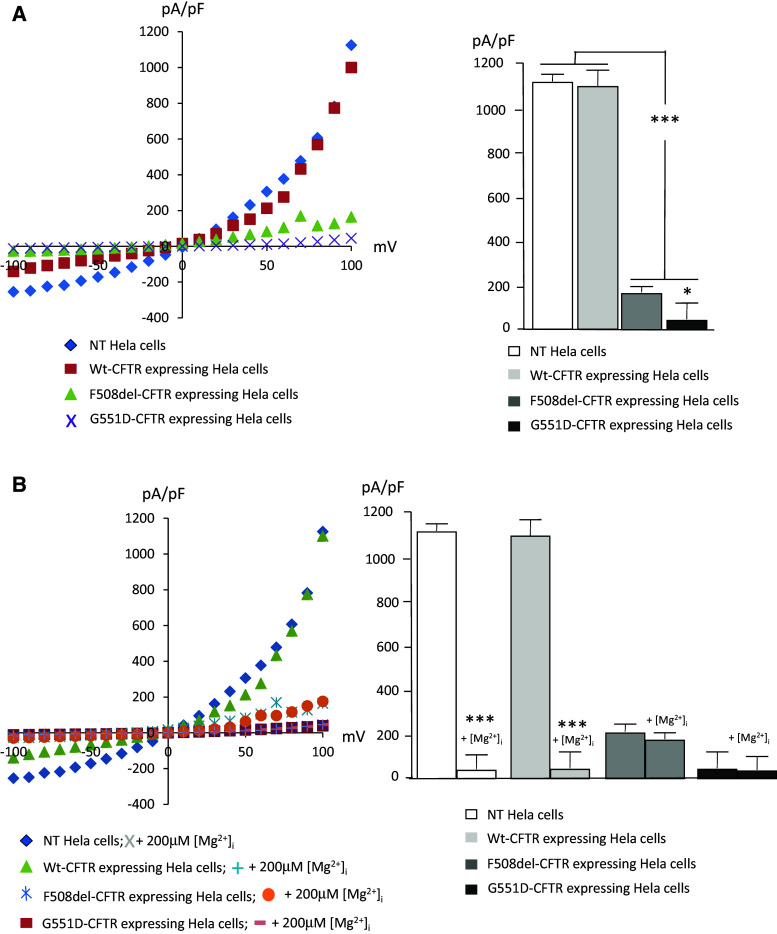
Fig. 5.
Function and regulation of TRPM7. Patch-clamp analysis was performed in NT Hela cells and in cells expressing, WT-CFTR, ΔF508-CFTR or and G551D-CFTR. a The left panel shows example current–voltage (I-V) relationships for TRPM7 channels obtained in the four cell lines with Mg2+-free intracellular solution. I–V relationships were taken at the time point when current magnitude reached maximum for each cell. Statistical analysis was performed using the pA/pF values taken at 100 mV and are presented as bar chart (right panel). Whereas currents are similar in NT and WT-CFTR cells, they were significantly decreased in ΔF508-CFTR and G551D-CFTR cells. A difference is also observed between cells expressing the mutated CFTR. The currents are significantly lower when in G551D-CFTR cells than in ΔF508-CFTR cells. b Comparison of the I–V relationships for TRPM7 channels in the four cell lines, with 200 μM Mg2+ and without Mg2+ in the intracellular solution (left panel). Bar chart (right panel) shows that whereas the function of TRPM7 is inhibited by Mg2+ in NT and WT-CFTR cells, no inhibition is observed in the cells expressing either ΔF508-CFTR or G551D-CFTR

