Fig. 1.

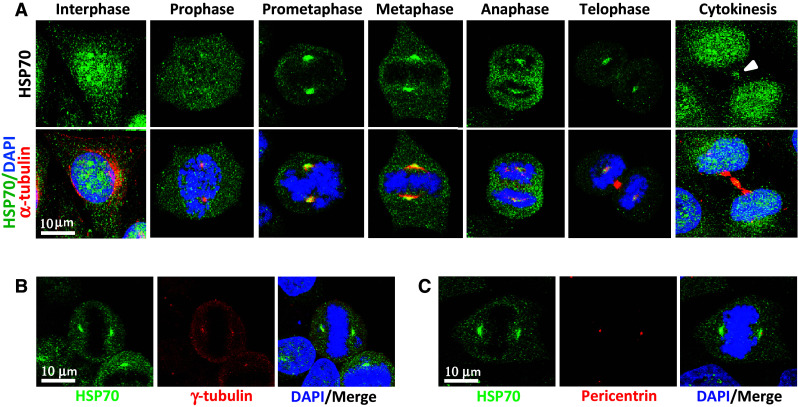
HSP70 accumulates at the mitotic centrosome. a Representative images of cellular distribution of HSP70 in CGL2 cells. Logarithmically growing cells were fixed and stained for HSP70 (green) and α-tubulin (red). The nuclei or chromosomes were counterstained with DAPI (blue). Colocalization of HSP70 with γ-tubulin (b) and pericentrin (c). Logarithmically growing CGL2 cells were fixed and stained for HSP70 (green) and γ-tubulin or pericentrin (red)
