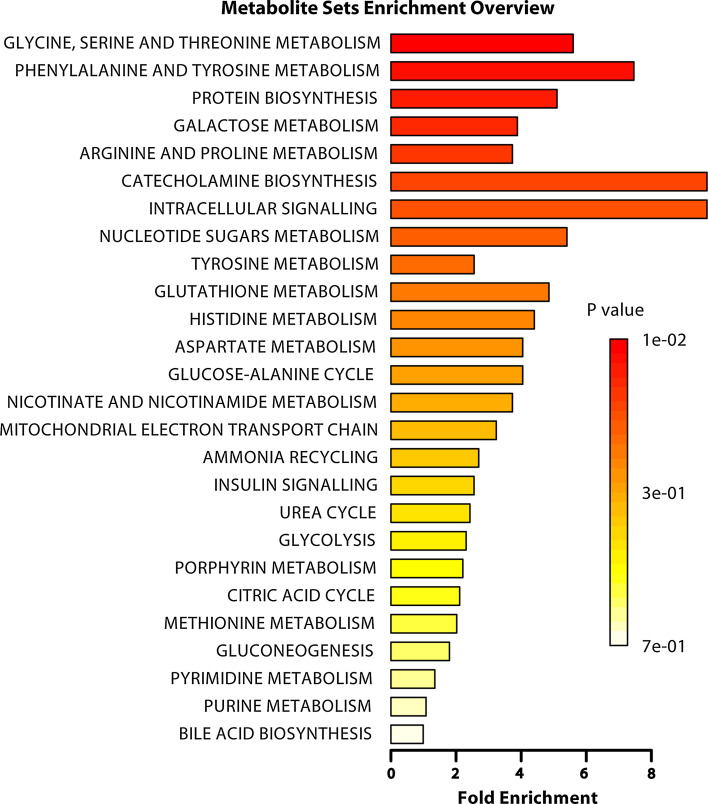
Fig. 5.
Summary plot for the over representation analysis of metabolic pathways associated with the complete list of metabolites shown in Table 1. The p values for the metabolic pathways are color coded with dark red being highly significant and white being least significant. The category “intracellular signaling” stands for intracellular signaling through the H2 receptor and histamine

