Fig. 3.
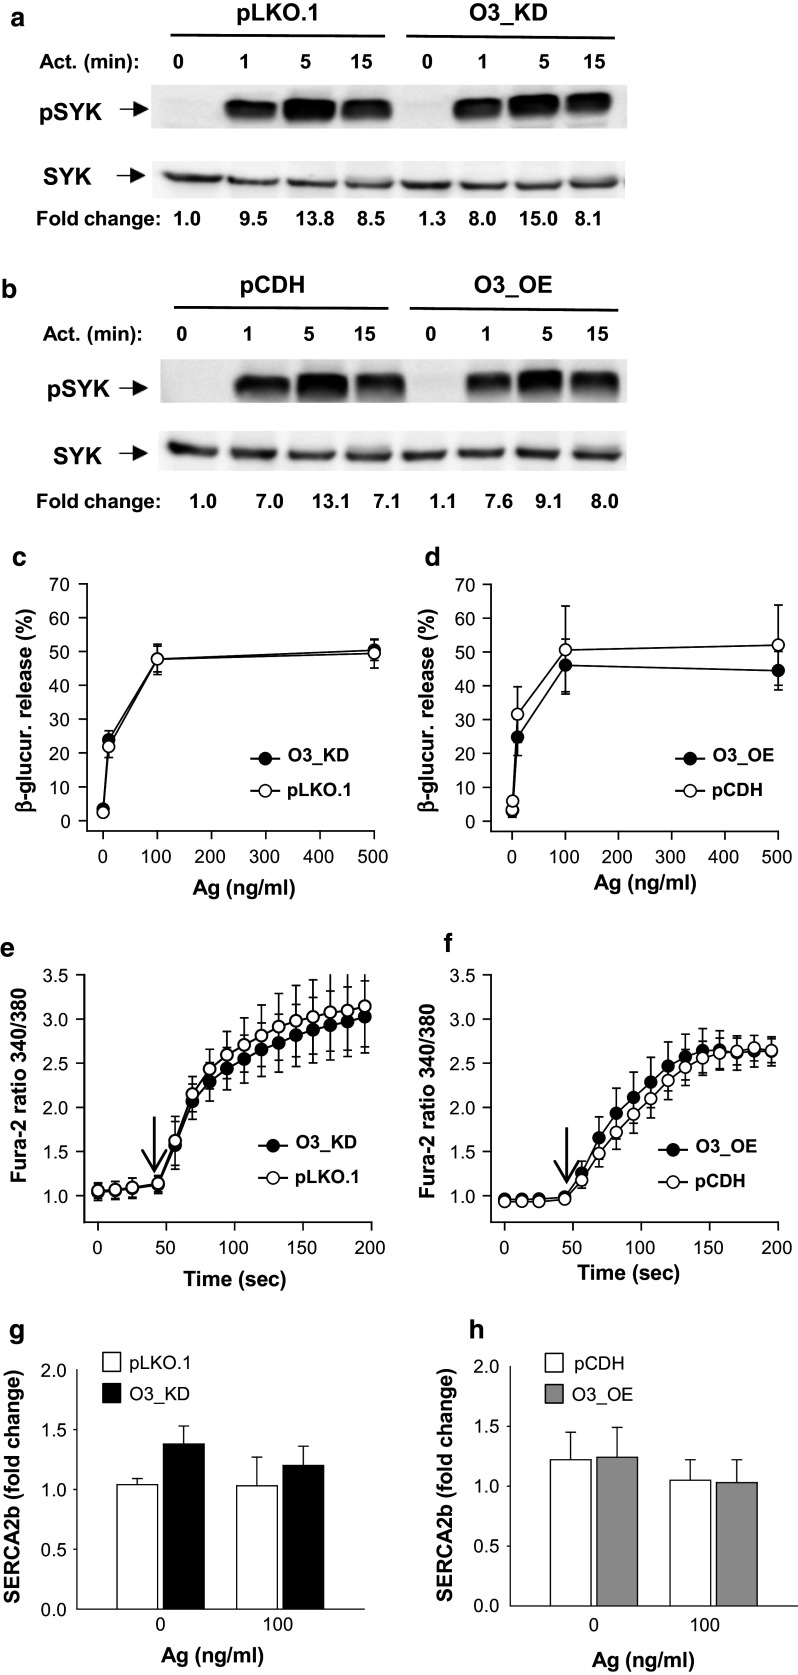
Early activation events in BMMCs with enhanced or reduced ORMDL3 expression. a Ag-induced tyrosine phosphorylation of SYK as determined by immunoblotting of whole-cell lysates from BMMCs with O3_KD or control cells transfected with empty pLKO.1. IgE-sensitized cells were activated for various time intervals with Ag (100 ng/ml). The positions of pSYK and SYK, used as loading controls, are indicated by arrows. b Phosphorylation of SYK was examined as in a, except that the lysates were from cells with O3_OE or control cells transfected with empty pCDH. Representative immunoblots from at least three performed in each group are shown in a and b. Numbers under the immunoblots indicate the relative amounts of pSYK normalized to its amounts in nonactivated cells transduced with empty vectors and total amounts of SYK in individual samples (fold change). c, d β-Glucuronidase release in IgE-sensitized BMMCs. The cells were activated with various concentrations of Ag and after 30 min β-glucuronidase released into the supernatant was determined. Data presented are means and SEMs for cells with O3_KD (c, n = 19), pLKO.1 controls (c, n = 19), O3_OE (d, n = 8), and pCDH control cells (d, n = 5). e, f Calcium response in IgE-sensitized BMMCs activated with Ag (100 ng/ml) for various time intervals. Arrows show the time points when Ag was added. Means and SEMs were calculated for cells with O3_KD (e, n = 16), pLKO.1 controls (e, n = 8), O3_OE (f, n = 3), and pCDH controls (f, n = 5). g, h RT-qPCR quantification of SERCA2b mRNA in resting and activated BMMCs with O3_KD (g, n = 4) pLKO.1 controls (g, n = 4), O3_OE (h, n = 4) and pCDH controls (h, n = 4). Data for SERCA2b mRNA were normalized as described in “Materials and methods”

