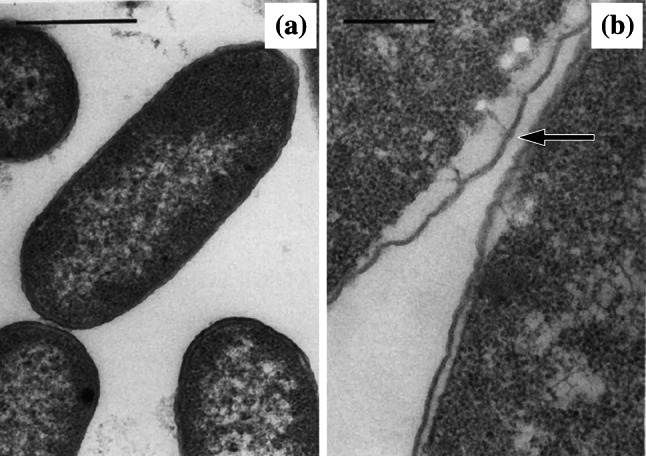
Fig. 9.

Transmission electron micrographs of a untreated Enterobacter cloacae NCTC 1005 and b cells of the same strain treated with 12.5 µg/mL (0.83×MIC) trimethoprim for 4 h. Arrow shows where the layers of the cell envelope appear to have separated. Bar for a 0.5 µm and b 0.25 µm.
Images from [195] by permission of the Journal of Medical Microbiology (MicroSoc)
