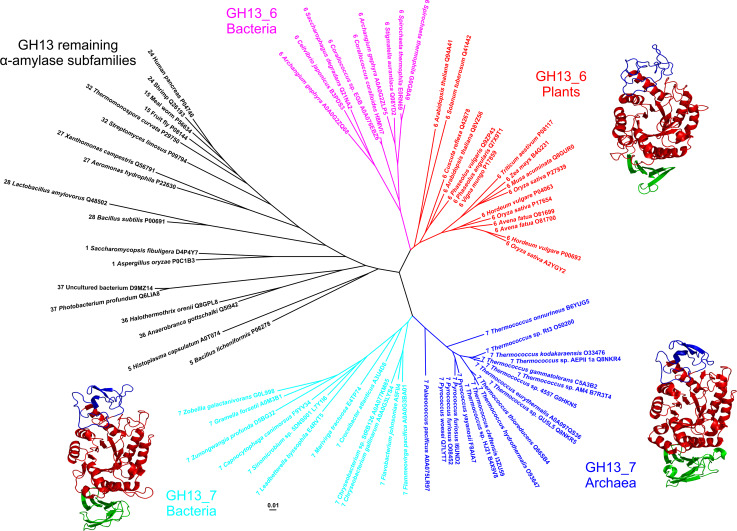
Fig. 2.
Evolutionary tree of the family GH13 α-amylases with focus on the subfamilies GH13_6 and GH13_7. The tree is based on the alignment of seven conserved sequence regions, shown in Fig. 1. The tree was calculated using the neighbor-joining clustering [222] implemented in the Clustal-W2 phylogeny package [223] available at the European Bioinformatics Institute’s web-site (http://www.ebi.ac.uk/), and then displayed with the program iTOL [224]. Tertiary structures of representatives of flavobacterial, archeal and plant family GH13 α-amylases are shown near their clusters in the tree. Sources of the α-amylases: Sinomicrobium sp. 5DNS001 [81] (subfamily GH13_7; flavobacteria); Pyrococcus woesei [72] (subfamily GH13_7; archaea); Hordeum vulgare—barley high pI isozyme AMY-2 [61] (subfamily GH13_6; plants). The archaeal and plant α-amylases are experimentally solved crystal structures retrieved from the Protein Data Bank (PDB) [225] under the PDB codes 1MWO and 1AMY, respectively. The flavobacterial α-amylase is a tertiary structure model obtained at the fold recognition server Phyre-2 [89] for its amino acid sequence (UniProt accession number: L7Y1I6; residues: Gly52-Gly477) based on the P. woesei α-amylase structure (1MWO) as template. The individual domains are colored as follows: catalytic (β/α)8-barrel—red, domain B—blue, domain C—green. The structural models were displayed with the program PyMol [226]

