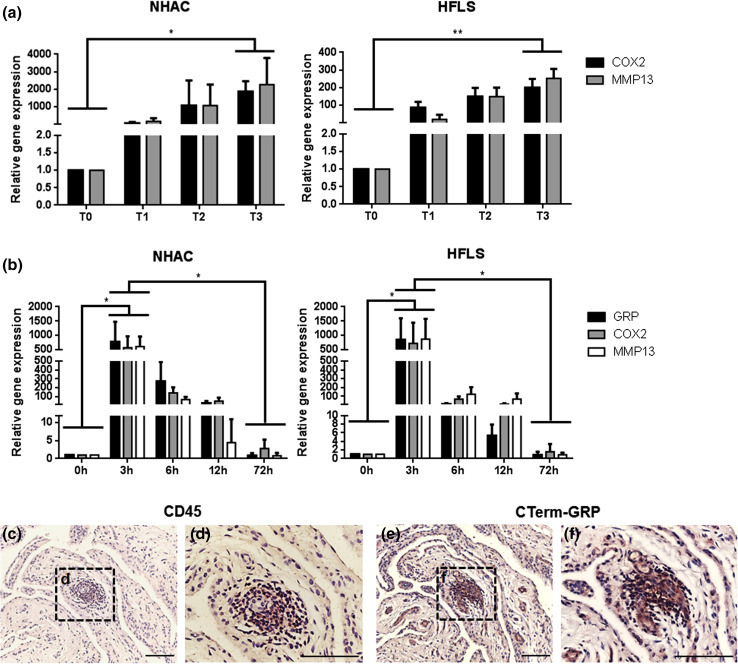
Fig. 6.
In vitro and in vivo studies of GRP association with inflammatory events in osteoarthritis. a Gene expression of COX2 and MMP13 over 3 weeks of mineralizing treatment (5.4 mM calcium) in NHAC and HFLS (each week a set point, T0–T3). Values of gene expression are relative to the reference sample (T0) and set to 1. Data are representative of three independent experiments. Two-way Anova and multiple comparisons were achieved with the Tukey’s test. Statistical significance was defined as P ≤ 0.05 (*) and P ≤ 0.005 (**). b Gene expression levels of COX2, MMP13 and GRP in NHAC and HFLS cells, after 72-h inflammatory stimulation with 5 ng/mL IL-1β. Values are relative to the reference sample (0 h). Data are representative of three independent experiments. Two-way Anova and multiple comparisons were achieved with the Tukey’s test. Statistical significance was defined as P ≤ 0.05 (*). c–f Immunodetection of CD45, showing leucocyte infiltration sites (c and d) and total GRP (e and f, CTerm-GRP antibody) in consecutive sections of osteoarthritic synovial membrane samples. Counterstaining with HE; sale bar represents 100 µm

