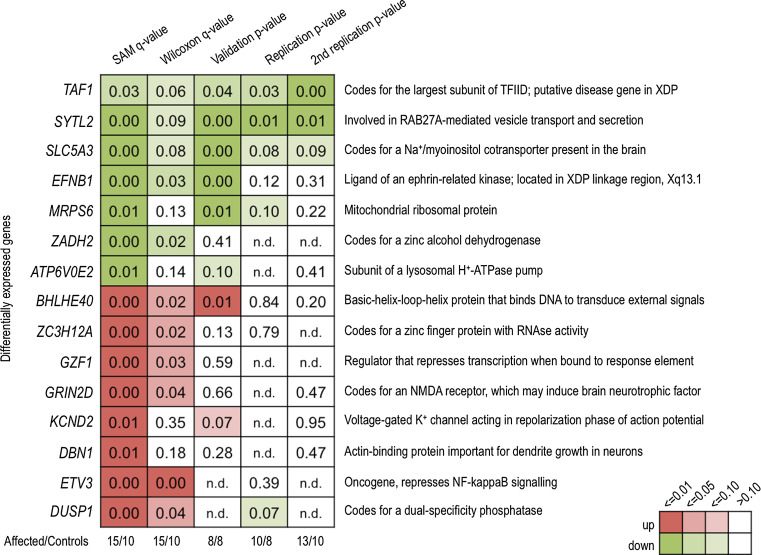
Fig. 3.
Heat map showing the performance of different genes chosen for follow-up, using microarray (SAM q value, Wilcoxon q value) and qPCR analysis. Data is from fibroblast-derived RNA. One criteria for selection of genes to follow-up was biological function (right-hand labels). Amongst differentially expressed genes, there were strikingly consistent signals in TAF1, SYTL2, and SLC5A3, and less consistently so, in EFNB1 and MRPS6. SAM significance analysis of microarrays

