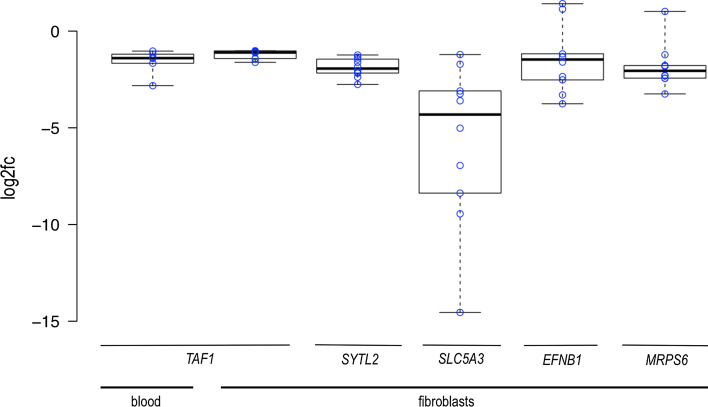
Fig. 4.
Sample level analysis in blood- and fibroblast-derived cDNA, target vs. reference genes. Blue circles represent log2 relative expression in individual samples from affected individuals vs. average expression in controls. There were no samples from affected individuals with overexpression of TAF1, SYTL2, and SLC5A3. Boxplot whiskers extend to minimum and maximum values

